Chippewa vs Immigrants from Kuwait Female Poverty Among 18-24 Year Olds
COMPARE
Chippewa
Immigrants from Kuwait
Female Poverty Among 18-24 Year Olds
Female Poverty Among 18-24 Year Olds Comparison
Chippewa
Immigrants from Kuwait
25.9%
FEMALE POVERTY AMONG 18-24 YEAR OLDS
0.0/ 100
METRIC RATING
331st/ 347
METRIC RANK
23.0%
FEMALE POVERTY AMONG 18-24 YEAR OLDS
0.0/ 100
METRIC RATING
305th/ 347
METRIC RANK
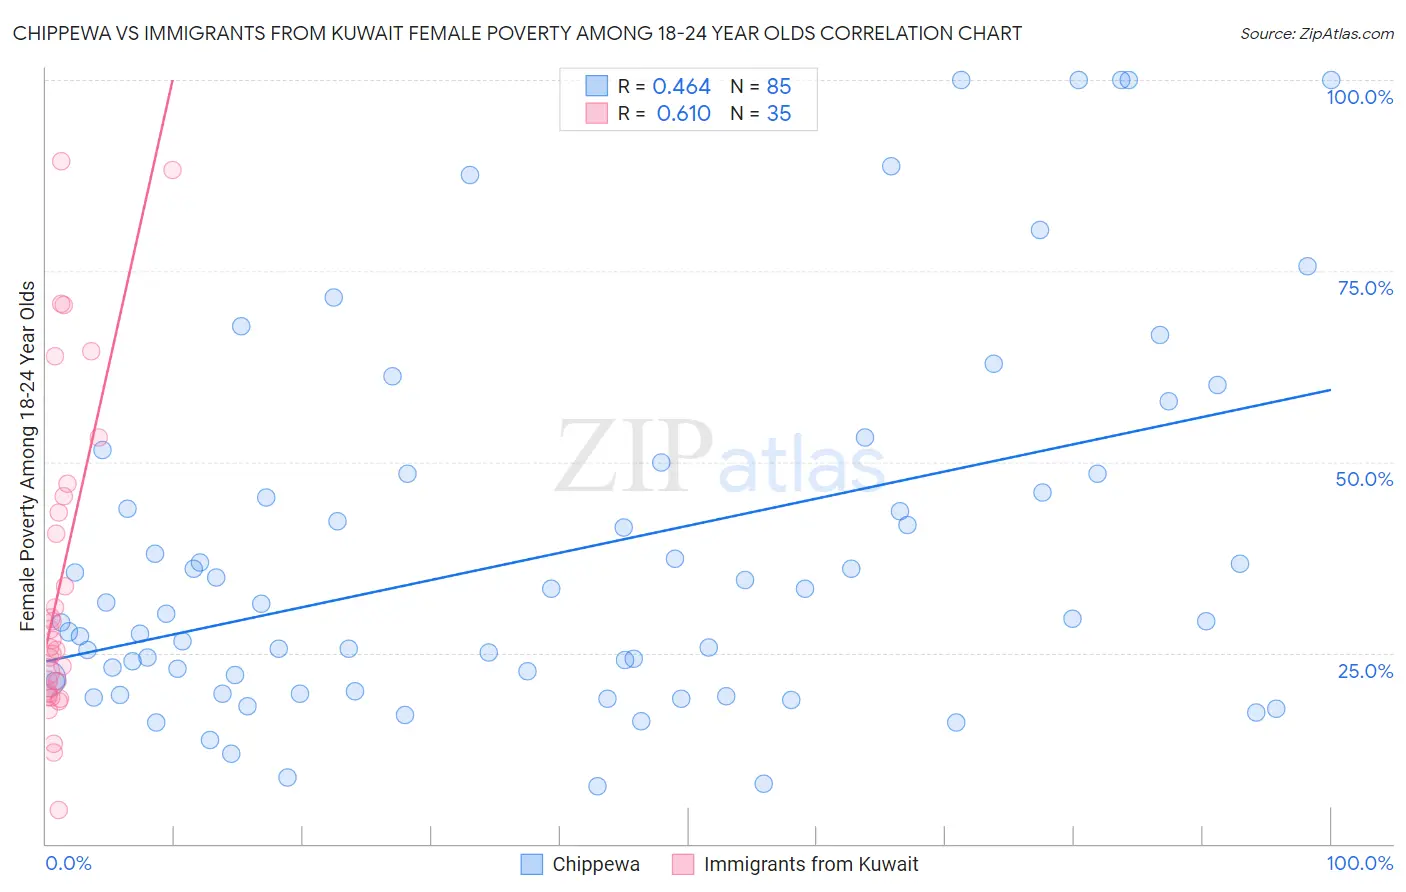
Chippewa vs Immigrants from Kuwait Female Poverty Among 18-24 Year Olds Correlation Chart
The statistical analysis conducted on geographies consisting of 211,620,289 people shows a moderate positive correlation between the proportion of Chippewa and poverty level among females between the ages 18 and 24 in the United States with a correlation coefficient (R) of 0.464 and weighted average of 25.9%. Similarly, the statistical analysis conducted on geographies consisting of 136,006,240 people shows a significant positive correlation between the proportion of Immigrants from Kuwait and poverty level among females between the ages 18 and 24 in the United States with a correlation coefficient (R) of 0.610 and weighted average of 23.0%, a difference of 12.5%.
Female Poverty Among 18-24 Year Olds Correlation Summary
| Measurement | Chippewa | Immigrants from Kuwait |
| Minimum | 7.5% | 4.4% |
| Maximum | 100.0% | 89.4% |
| Range | 92.5% | 85.0% |
| Mean | 37.8% | 34.5% |
| Median | 29.4% | 25.6% |
| Interquartile 25% (IQ1) | 20.7% | 19.6% |
| Interquartile 75% (IQ3) | 47.2% | 45.5% |
| Interquartile Range (IQR) | 26.5% | 25.9% |
| Standard Deviation (Sample) | 23.8% | 21.5% |
| Standard Deviation (Population) | 23.7% | 21.2% |
Similar Demographics by Female Poverty Among 18-24 Year Olds
Demographics Similar to Chippewa by Female Poverty Among 18-24 Year Olds
In terms of female poverty among 18-24 year olds, the demographic groups most similar to Chippewa are Immigrants from Somalia (25.7%, a difference of 0.65%), Cajun (25.7%, a difference of 0.86%), Houma (26.2%, a difference of 1.0%), Apache (26.3%, a difference of 1.6%), and Native/Alaskan (25.4%, a difference of 2.0%).
| Demographics | Rating | Rank | Female Poverty Among 18-24 Year Olds |
| German Russians | 0.0 /100 | #324 | Tragic 25.2% |
| Immigrants | Saudi Arabia | 0.0 /100 | #325 | Tragic 25.3% |
| Yakama | 0.0 /100 | #326 | Tragic 25.3% |
| Ute | 0.0 /100 | #327 | Tragic 25.4% |
| Natives/Alaskans | 0.0 /100 | #328 | Tragic 25.4% |
| Cajuns | 0.0 /100 | #329 | Tragic 25.7% |
| Immigrants | Somalia | 0.0 /100 | #330 | Tragic 25.7% |
| Chippewa | 0.0 /100 | #331 | Tragic 25.9% |
| Houma | 0.0 /100 | #332 | Tragic 26.2% |
| Apache | 0.0 /100 | #333 | Tragic 26.3% |
| Pueblo | 0.0 /100 | #334 | Tragic 26.9% |
| Yup'ik | 0.0 /100 | #335 | Tragic 27.0% |
| Immigrants | Yemen | 0.0 /100 | #336 | Tragic 27.5% |
| Cheyenne | 0.0 /100 | #337 | Tragic 28.1% |
| Hopi | 0.0 /100 | #338 | Tragic 28.2% |
Demographics Similar to Immigrants from Kuwait by Female Poverty Among 18-24 Year Olds
In terms of female poverty among 18-24 year olds, the demographic groups most similar to Immigrants from Kuwait are Sudanese (23.0%, a difference of 0.050%), Senegalese (23.0%, a difference of 0.19%), Iroquois (22.9%, a difference of 0.35%), Seminole (22.9%, a difference of 0.74%), and African (22.8%, a difference of 0.83%).
| Demographics | Rating | Rank | Female Poverty Among 18-24 Year Olds |
| Central American Indians | 0.0 /100 | #298 | Tragic 22.6% |
| Cherokee | 0.0 /100 | #299 | Tragic 22.7% |
| Africans | 0.0 /100 | #300 | Tragic 22.8% |
| Seminole | 0.0 /100 | #301 | Tragic 22.9% |
| Iroquois | 0.0 /100 | #302 | Tragic 22.9% |
| Senegalese | 0.0 /100 | #303 | Tragic 23.0% |
| Sudanese | 0.0 /100 | #304 | Tragic 23.0% |
| Immigrants | Kuwait | 0.0 /100 | #305 | Tragic 23.0% |
| Paiute | 0.0 /100 | #306 | Tragic 23.3% |
| Cree | 0.0 /100 | #307 | Tragic 23.4% |
| Immigrants | Sudan | 0.0 /100 | #308 | Tragic 23.5% |
| Blackfeet | 0.0 /100 | #309 | Tragic 23.6% |
| Comanche | 0.0 /100 | #310 | Tragic 23.6% |
| Potawatomi | 0.0 /100 | #311 | Tragic 23.7% |
| Yuman | 0.0 /100 | #312 | Tragic 24.0% |