Chippewa vs German Seniors Poverty Over the Age of 65
COMPARE
Chippewa
German
Seniors Poverty Over the Age of 65
Seniors Poverty Over the Age of 65 Comparison
Chippewa
Germans
12.1%
SENIORS POVERTY OVER THE AGE OF 65
0.7/ 100
METRIC RATING
245th/ 347
METRIC RANK
9.0%
SENIORS POVERTY OVER THE AGE OF 65
100.0/ 100
METRIC RATING
7th/ 347
METRIC RANK
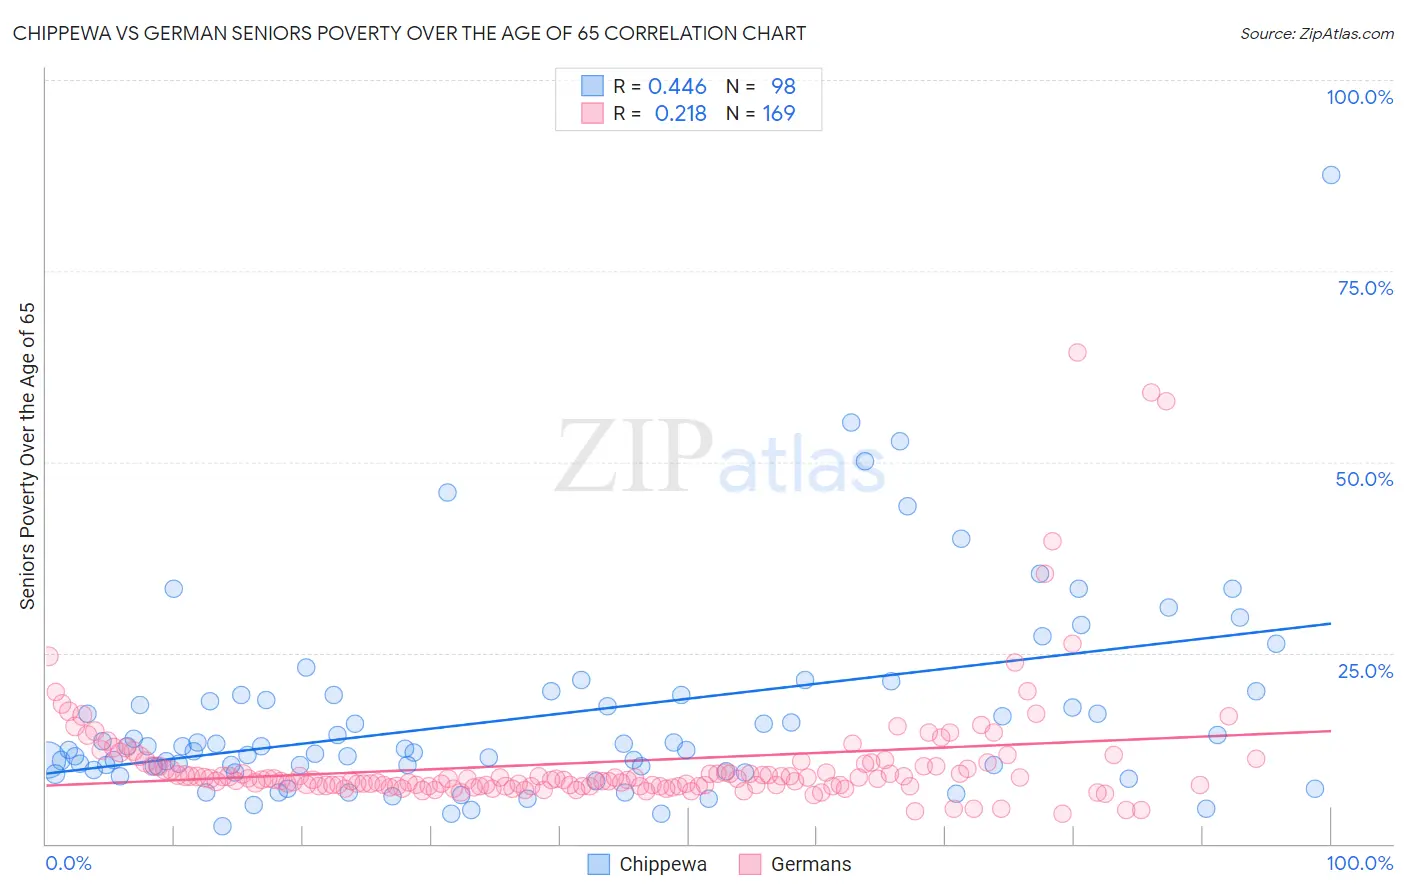
Chippewa vs German Seniors Poverty Over the Age of 65 Correlation Chart
The statistical analysis conducted on geographies consisting of 214,533,274 people shows a moderate positive correlation between the proportion of Chippewa and poverty level among seniors over the age of 65 in the United States with a correlation coefficient (R) of 0.446 and weighted average of 12.1%. Similarly, the statistical analysis conducted on geographies consisting of 574,200,569 people shows a weak positive correlation between the proportion of Germans and poverty level among seniors over the age of 65 in the United States with a correlation coefficient (R) of 0.218 and weighted average of 9.0%, a difference of 35.6%.
Seniors Poverty Over the Age of 65 Correlation Summary
| Measurement | Chippewa | German |
| Minimum | 2.3% | 3.9% |
| Maximum | 87.5% | 64.3% |
| Range | 85.2% | 60.4% |
| Mean | 16.7% | 10.7% |
| Median | 12.4% | 8.4% |
| Interquartile 25% (IQ1) | 9.6% | 7.6% |
| Interquartile 75% (IQ3) | 19.4% | 10.1% |
| Interquartile Range (IQR) | 9.8% | 2.5% |
| Standard Deviation (Sample) | 13.1% | 8.2% |
| Standard Deviation (Population) | 13.0% | 8.2% |
Similar Demographics by Seniors Poverty Over the Age of 65
Demographics Similar to Chippewa by Seniors Poverty Over the Age of 65
In terms of seniors poverty over the age of 65, the demographic groups most similar to Chippewa are Immigrants from Portugal (12.1%, a difference of 0.11%), Cree (12.1%, a difference of 0.11%), Japanese (12.2%, a difference of 0.22%), Spanish American (12.2%, a difference of 0.23%), and Ute (12.2%, a difference of 0.28%).
| Demographics | Rating | Rank | Seniors Poverty Over the Age of 65 |
| Seminole | 1.1 /100 | #238 | Tragic 12.0% |
| Immigrants | Spain | 1.0 /100 | #239 | Tragic 12.1% |
| Comanche | 0.9 /100 | #240 | Tragic 12.1% |
| Immigrants | Albania | 0.9 /100 | #241 | Tragic 12.1% |
| Sub-Saharan Africans | 0.9 /100 | #242 | Tragic 12.1% |
| Uruguayans | 0.8 /100 | #243 | Tragic 12.1% |
| Immigrants | Portugal | 0.8 /100 | #244 | Tragic 12.1% |
| Chippewa | 0.7 /100 | #245 | Tragic 12.1% |
| Cree | 0.7 /100 | #246 | Tragic 12.1% |
| Japanese | 0.6 /100 | #247 | Tragic 12.2% |
| Spanish Americans | 0.6 /100 | #248 | Tragic 12.2% |
| Ute | 0.6 /100 | #249 | Tragic 12.2% |
| Immigrants | Liberia | 0.5 /100 | #250 | Tragic 12.2% |
| Somalis | 0.3 /100 | #251 | Tragic 12.3% |
| Armenians | 0.3 /100 | #252 | Tragic 12.3% |
Demographics Similar to Germans by Seniors Poverty Over the Age of 65
In terms of seniors poverty over the age of 65, the demographic groups most similar to Germans are Czech (9.0%, a difference of 0.53%), English (9.1%, a difference of 1.2%), Lithuanian (9.1%, a difference of 1.3%), Danish (8.8%, a difference of 1.6%), and Maltese (9.1%, a difference of 1.7%).
| Demographics | Rating | Rank | Seniors Poverty Over the Age of 65 |
| Chinese | 100.0 /100 | #1 | Exceptional 8.3% |
| Tlingit-Haida | 100.0 /100 | #2 | Exceptional 8.3% |
| Norwegians | 100.0 /100 | #3 | Exceptional 8.7% |
| Swedes | 100.0 /100 | #4 | Exceptional 8.7% |
| Immigrants | India | 100.0 /100 | #5 | Exceptional 8.8% |
| Danes | 100.0 /100 | #6 | Exceptional 8.8% |
| Germans | 100.0 /100 | #7 | Exceptional 9.0% |
| Czechs | 100.0 /100 | #8 | Exceptional 9.0% |
| English | 100.0 /100 | #9 | Exceptional 9.1% |
| Lithuanians | 100.0 /100 | #10 | Exceptional 9.1% |
| Maltese | 99.9 /100 | #11 | Exceptional 9.1% |
| Scandinavians | 99.9 /100 | #12 | Exceptional 9.1% |
| Croatians | 99.9 /100 | #13 | Exceptional 9.1% |
| Poles | 99.9 /100 | #14 | Exceptional 9.1% |
| Dutch | 99.9 /100 | #15 | Exceptional 9.1% |