Chippewa vs Albanian Child Poverty Among Boys Under 16
COMPARE
Chippewa
Albanian
Child Poverty Among Boys Under 16
Child Poverty Among Boys Under 16 Comparison
Chippewa
Albanians
21.0%
CHILD POVERTY AMONG BOYS UNDER 16
0.0/ 100
METRIC RATING
298th/ 347
METRIC RANK
15.6%
CHILD POVERTY AMONG BOYS UNDER 16
86.5/ 100
METRIC RATING
139th/ 347
METRIC RANK
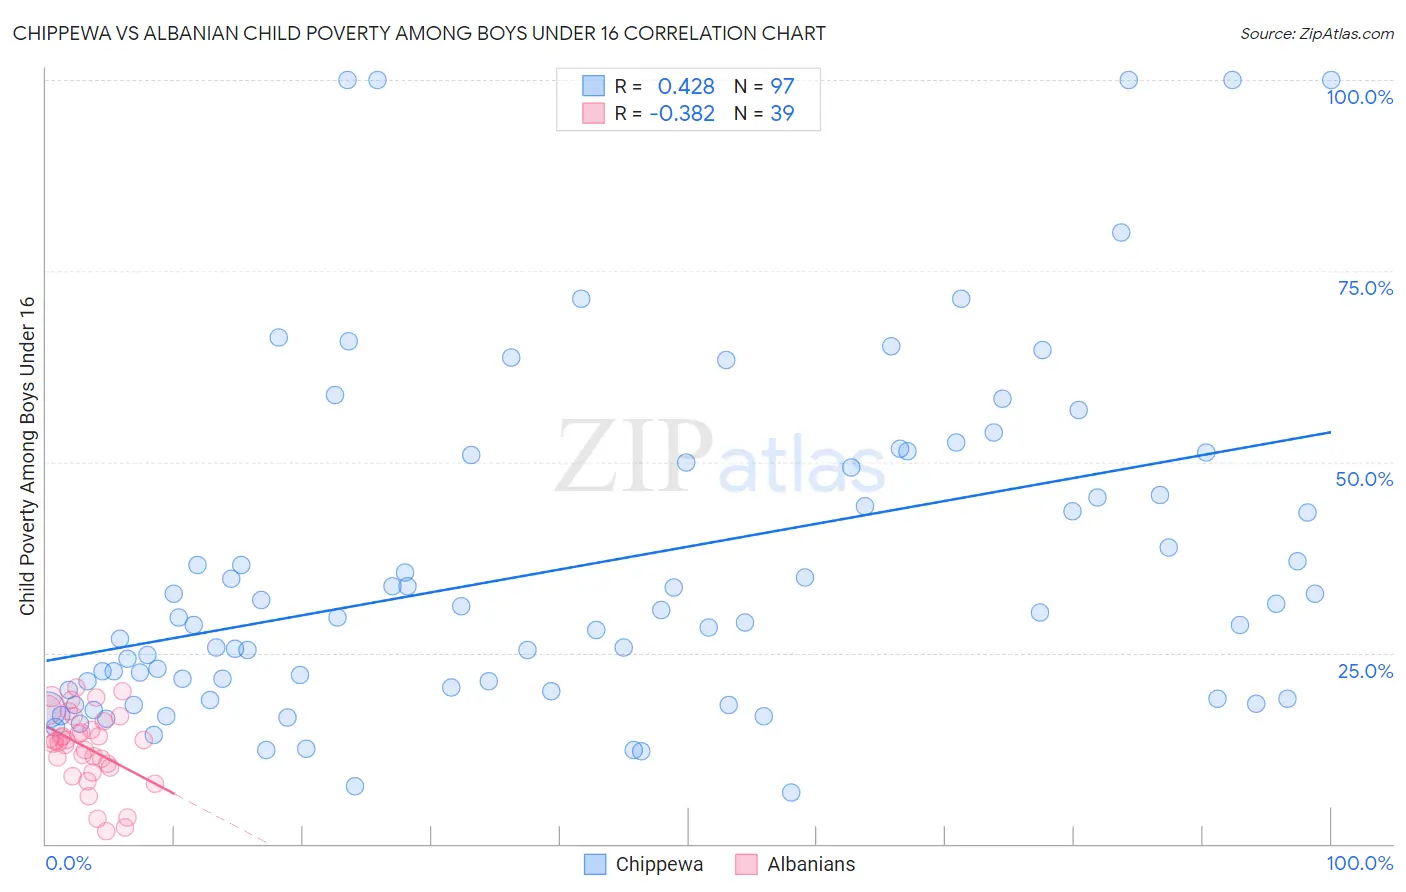
Chippewa vs Albanian Child Poverty Among Boys Under 16 Correlation Chart
The statistical analysis conducted on geographies consisting of 213,098,717 people shows a moderate positive correlation between the proportion of Chippewa and poverty level among boys under the age of 16 in the United States with a correlation coefficient (R) of 0.428 and weighted average of 21.0%. Similarly, the statistical analysis conducted on geographies consisting of 190,811,063 people shows a mild negative correlation between the proportion of Albanians and poverty level among boys under the age of 16 in the United States with a correlation coefficient (R) of -0.382 and weighted average of 15.6%, a difference of 34.6%.
Child Poverty Among Boys Under 16 Correlation Summary
| Measurement | Chippewa | Albanian |
| Minimum | 6.7% | 1.7% |
| Maximum | 100.0% | 20.4% |
| Range | 93.3% | 18.7% |
| Mean | 36.2% | 12.6% |
| Median | 29.7% | 13.5% |
| Interquartile 25% (IQ1) | 20.1% | 9.9% |
| Interquartile 75% (IQ3) | 49.6% | 16.0% |
| Interquartile Range (IQR) | 29.5% | 6.1% |
| Standard Deviation (Sample) | 22.2% | 4.8% |
| Standard Deviation (Population) | 22.1% | 4.8% |
Similar Demographics by Child Poverty Among Boys Under 16
Demographics Similar to Chippewa by Child Poverty Among Boys Under 16
In terms of child poverty among boys under 16, the demographic groups most similar to Chippewa are Hispanic or Latino (20.9%, a difference of 0.26%), Immigrants from Caribbean (21.0%, a difference of 0.27%), Haitian (21.0%, a difference of 0.32%), Indonesian (20.8%, a difference of 0.86%), and Guatemalan (21.1%, a difference of 0.86%).
| Demographics | Rating | Rank | Child Poverty Among Boys Under 16 |
| Immigrants | Latin America | 0.0 /100 | #291 | Tragic 20.6% |
| Yaqui | 0.0 /100 | #292 | Tragic 20.7% |
| Immigrants | Senegal | 0.0 /100 | #293 | Tragic 20.7% |
| Immigrants | Bahamas | 0.0 /100 | #294 | Tragic 20.7% |
| Mexicans | 0.0 /100 | #295 | Tragic 20.7% |
| Indonesians | 0.0 /100 | #296 | Tragic 20.8% |
| Hispanics or Latinos | 0.0 /100 | #297 | Tragic 20.9% |
| Chippewa | 0.0 /100 | #298 | Tragic 21.0% |
| Immigrants | Caribbean | 0.0 /100 | #299 | Tragic 21.0% |
| Haitians | 0.0 /100 | #300 | Tragic 21.0% |
| Guatemalans | 0.0 /100 | #301 | Tragic 21.1% |
| Somalis | 0.0 /100 | #302 | Tragic 21.1% |
| Immigrants | Haiti | 0.0 /100 | #303 | Tragic 21.3% |
| Immigrants | Central America | 0.0 /100 | #304 | Tragic 21.3% |
| Kiowa | 0.0 /100 | #305 | Tragic 21.3% |
Demographics Similar to Albanians by Child Poverty Among Boys Under 16
In terms of child poverty among boys under 16, the demographic groups most similar to Albanians are Immigrants from Southern Europe (15.6%, a difference of 0.010%), Immigrants from Spain (15.6%, a difference of 0.15%), Immigrants from Kuwait (15.6%, a difference of 0.22%), Icelander (15.5%, a difference of 0.25%), and Portuguese (15.5%, a difference of 0.27%).
| Demographics | Rating | Rank | Child Poverty Among Boys Under 16 |
| Immigrants | Kazakhstan | 88.7 /100 | #132 | Excellent 15.5% |
| Welsh | 88.3 /100 | #133 | Excellent 15.5% |
| Peruvians | 88.1 /100 | #134 | Excellent 15.5% |
| Portuguese | 87.5 /100 | #135 | Excellent 15.5% |
| Icelanders | 87.5 /100 | #136 | Excellent 15.5% |
| Immigrants | Spain | 87.1 /100 | #137 | Excellent 15.6% |
| Immigrants | Southern Europe | 86.5 /100 | #138 | Excellent 15.6% |
| Albanians | 86.5 /100 | #139 | Excellent 15.6% |
| Immigrants | Kuwait | 85.6 /100 | #140 | Excellent 15.6% |
| Slavs | 84.5 /100 | #141 | Excellent 15.7% |
| Immigrants | Hungary | 84.1 /100 | #142 | Excellent 15.7% |
| Immigrants | Fiji | 83.6 /100 | #143 | Excellent 15.7% |
| Immigrants | Peru | 83.5 /100 | #144 | Excellent 15.7% |
| Samoans | 83.2 /100 | #145 | Excellent 15.7% |
| New Zealanders | 82.4 /100 | #146 | Excellent 15.7% |