Chinese vs Yakama Child Poverty Among Boys Under 16
COMPARE
Chinese
Yakama
Child Poverty Among Boys Under 16
Child Poverty Among Boys Under 16 Comparison
Chinese
Yakama
11.9%
CHILD POVERTY AMONG BOYS UNDER 16
100.0/ 100
METRIC RATING
5th/ 347
METRIC RANK
21.7%
CHILD POVERTY AMONG BOYS UNDER 16
0.0/ 100
METRIC RATING
318th/ 347
METRIC RANK
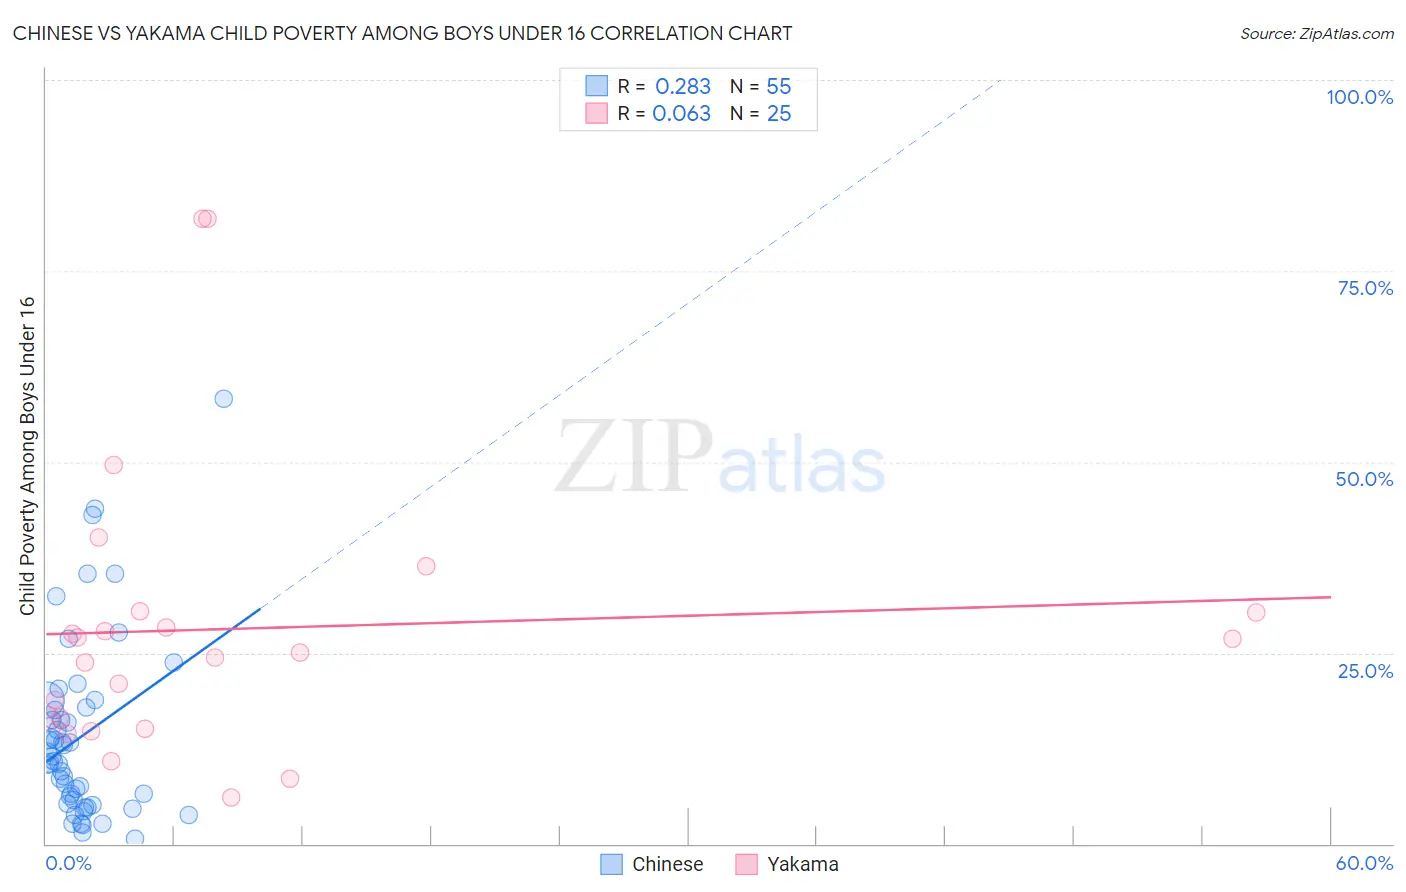
Chinese vs Yakama Child Poverty Among Boys Under 16 Correlation Chart
The statistical analysis conducted on geographies consisting of 64,708,230 people shows a weak positive correlation between the proportion of Chinese and poverty level among boys under the age of 16 in the United States with a correlation coefficient (R) of 0.283 and weighted average of 11.9%. Similarly, the statistical analysis conducted on geographies consisting of 19,821,804 people shows a slight positive correlation between the proportion of Yakama and poverty level among boys under the age of 16 in the United States with a correlation coefficient (R) of 0.063 and weighted average of 21.7%, a difference of 83.2%.
Child Poverty Among Boys Under 16 Correlation Summary
| Measurement | Chinese | Yakama |
| Minimum | 0.70% | 6.1% |
| Maximum | 58.3% | 81.8% |
| Range | 57.6% | 75.8% |
| Mean | 14.1% | 28.1% |
| Median | 10.7% | 25.0% |
| Interquartile 25% (IQ1) | 5.2% | 15.7% |
| Interquartile 75% (IQ3) | 17.9% | 30.4% |
| Interquartile Range (IQR) | 12.7% | 14.7% |
| Standard Deviation (Sample) | 11.9% | 18.9% |
| Standard Deviation (Population) | 11.8% | 18.6% |
Similar Demographics by Child Poverty Among Boys Under 16
Demographics Similar to Chinese by Child Poverty Among Boys Under 16
In terms of child poverty among boys under 16, the demographic groups most similar to Chinese are Thai (11.7%, a difference of 1.6%), Immigrants from Hong Kong (12.3%, a difference of 3.3%), Iranian (12.4%, a difference of 4.9%), Immigrants from Singapore (12.5%, a difference of 5.2%), and Immigrants from Iran (12.5%, a difference of 5.8%).
| Demographics | Rating | Rank | Child Poverty Among Boys Under 16 |
| Immigrants | India | 100.0 /100 | #1 | Exceptional 10.9% |
| Immigrants | Taiwan | 100.0 /100 | #2 | Exceptional 11.0% |
| Filipinos | 100.0 /100 | #3 | Exceptional 11.1% |
| Thais | 100.0 /100 | #4 | Exceptional 11.7% |
| Chinese | 100.0 /100 | #5 | Exceptional 11.9% |
| Immigrants | Hong Kong | 100.0 /100 | #6 | Exceptional 12.3% |
| Iranians | 100.0 /100 | #7 | Exceptional 12.4% |
| Immigrants | Singapore | 100.0 /100 | #8 | Exceptional 12.5% |
| Immigrants | Iran | 100.0 /100 | #9 | Exceptional 12.5% |
| Bhutanese | 100.0 /100 | #10 | Exceptional 12.6% |
| Immigrants | South Central Asia | 100.0 /100 | #11 | Exceptional 12.7% |
| Burmese | 99.9 /100 | #12 | Exceptional 13.0% |
| Immigrants | Korea | 99.9 /100 | #13 | Exceptional 13.0% |
| Immigrants | Ireland | 99.9 /100 | #14 | Exceptional 13.1% |
| Immigrants | Japan | 99.9 /100 | #15 | Exceptional 13.1% |
Demographics Similar to Yakama by Child Poverty Among Boys Under 16
In terms of child poverty among boys under 16, the demographic groups most similar to Yakama are African (21.7%, a difference of 0.060%), Immigrants from Somalia (21.7%, a difference of 0.14%), Menominee (21.7%, a difference of 0.14%), Dutch West Indian (21.8%, a difference of 0.48%), and Ute (21.6%, a difference of 0.74%).
| Demographics | Rating | Rank | Child Poverty Among Boys Under 16 |
| Bahamians | 0.0 /100 | #311 | Tragic 21.6% |
| Immigrants | Guatemala | 0.0 /100 | #312 | Tragic 21.6% |
| British West Indians | 0.0 /100 | #313 | Tragic 21.6% |
| Ute | 0.0 /100 | #314 | Tragic 21.6% |
| Immigrants | Somalia | 0.0 /100 | #315 | Tragic 21.7% |
| Menominee | 0.0 /100 | #316 | Tragic 21.7% |
| Africans | 0.0 /100 | #317 | Tragic 21.7% |
| Yakama | 0.0 /100 | #318 | Tragic 21.7% |
| Dutch West Indians | 0.0 /100 | #319 | Tragic 21.8% |
| U.S. Virgin Islanders | 0.0 /100 | #320 | Tragic 22.0% |
| Cajuns | 0.0 /100 | #321 | Tragic 22.2% |
| Immigrants | Dominica | 0.0 /100 | #322 | Tragic 22.2% |
| Hondurans | 0.0 /100 | #323 | Tragic 22.3% |
| Immigrants | Congo | 0.0 /100 | #324 | Tragic 22.4% |
| Central American Indians | 0.0 /100 | #325 | Tragic 22.5% |