Chinese vs Immigrants from Nepal Poverty
COMPARE
Chinese
Immigrants from Nepal
Poverty
Poverty Comparison
Chinese
Immigrants from Nepal
9.5%
POVERTY
100.0/ 100
METRIC RATING
2nd/ 347
METRIC RANK
12.2%
POVERTY
60.4/ 100
METRIC RATING
160th/ 347
METRIC RANK
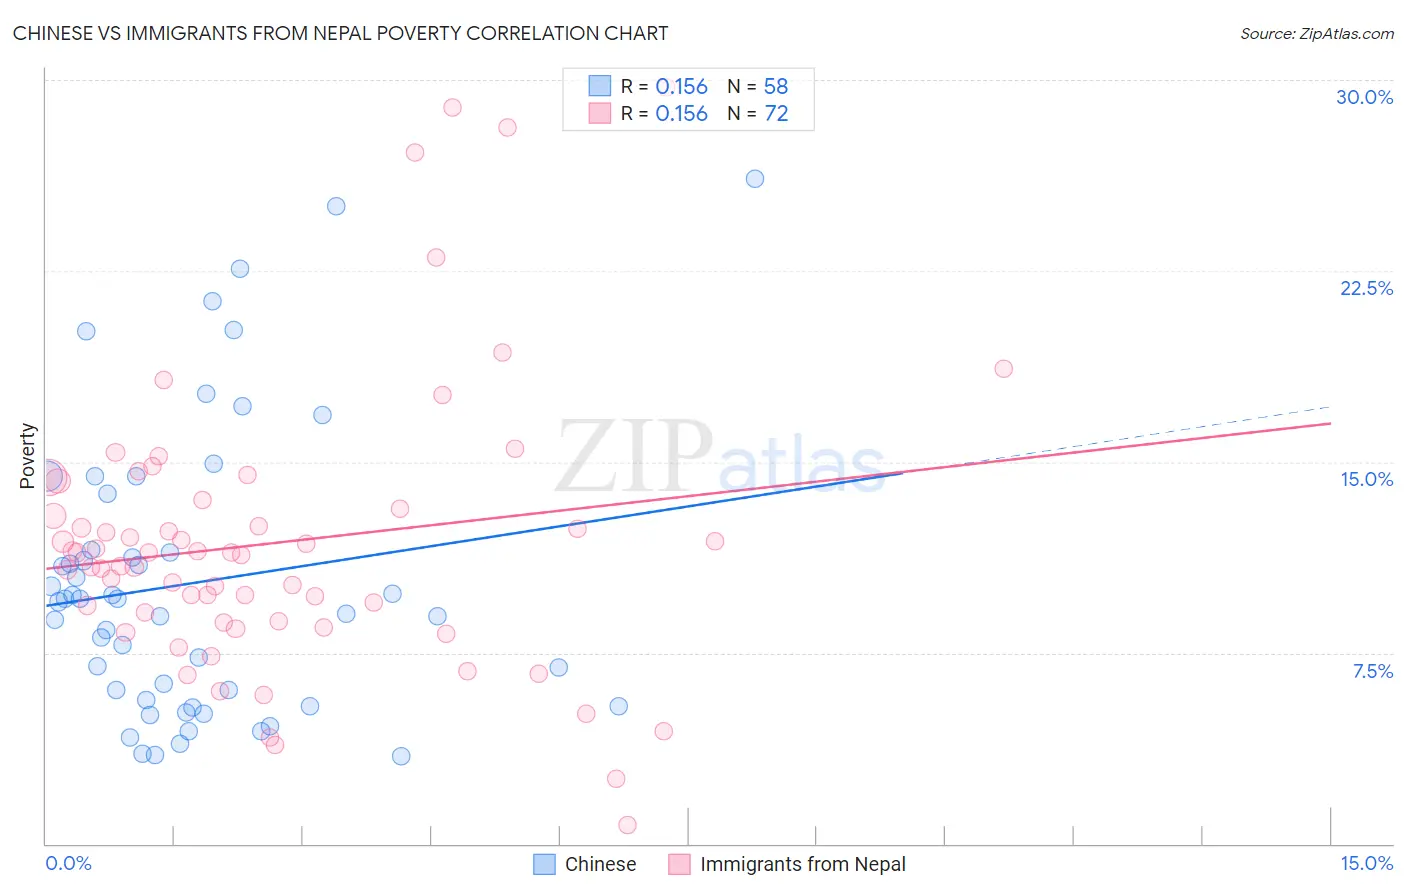
Chinese vs Immigrants from Nepal Poverty Correlation Chart
The statistical analysis conducted on geographies consisting of 64,802,428 people shows a poor positive correlation between the proportion of Chinese and poverty level in the United States with a correlation coefficient (R) of 0.156 and weighted average of 9.5%. Similarly, the statistical analysis conducted on geographies consisting of 186,715,196 people shows a poor positive correlation between the proportion of Immigrants from Nepal and poverty level in the United States with a correlation coefficient (R) of 0.156 and weighted average of 12.2%, a difference of 27.7%.
Poverty Correlation Summary
| Measurement | Chinese | Immigrants from Nepal |
| Minimum | 3.4% | 0.73% |
| Maximum | 26.1% | 29.7% |
| Range | 22.7% | 29.0% |
| Mean | 10.2% | 11.8% |
| Median | 9.6% | 11.4% |
| Interquartile 25% (IQ1) | 5.6% | 8.7% |
| Interquartile 75% (IQ3) | 11.6% | 13.3% |
| Interquartile Range (IQR) | 5.9% | 4.6% |
| Standard Deviation (Sample) | 5.6% | 5.6% |
| Standard Deviation (Population) | 5.5% | 5.6% |
Similar Demographics by Poverty
Demographics Similar to Chinese by Poverty
In terms of poverty, the demographic groups most similar to Chinese are Thai (9.6%, a difference of 0.45%), Immigrants from Taiwan (9.7%, a difference of 1.9%), Immigrants from Ireland (10.1%, a difference of 5.6%), Immigrants from India (9.0%, a difference of 5.6%), and Assyrian/Chaldean/Syriac (10.1%, a difference of 5.8%).
| Demographics | Rating | Rank | Poverty |
| Immigrants | India | 100.0 /100 | #1 | Exceptional 9.0% |
| Chinese | 100.0 /100 | #2 | Exceptional 9.5% |
| Thais | 100.0 /100 | #3 | Exceptional 9.6% |
| Immigrants | Taiwan | 100.0 /100 | #4 | Exceptional 9.7% |
| Immigrants | Ireland | 99.9 /100 | #5 | Exceptional 10.1% |
| Assyrians/Chaldeans/Syriacs | 99.9 /100 | #6 | Exceptional 10.1% |
| Filipinos | 99.9 /100 | #7 | Exceptional 10.1% |
| Maltese | 99.9 /100 | #8 | Exceptional 10.2% |
| Immigrants | South Central Asia | 99.9 /100 | #9 | Exceptional 10.2% |
| Bulgarians | 99.9 /100 | #10 | Exceptional 10.2% |
| Immigrants | Lithuania | 99.9 /100 | #11 | Exceptional 10.3% |
| Bhutanese | 99.8 /100 | #12 | Exceptional 10.4% |
| Immigrants | Hong Kong | 99.8 /100 | #13 | Exceptional 10.4% |
| Immigrants | Bolivia | 99.8 /100 | #14 | Exceptional 10.4% |
| Bolivians | 99.8 /100 | #15 | Exceptional 10.4% |
Demographics Similar to Immigrants from Nepal by Poverty
In terms of poverty, the demographic groups most similar to Immigrants from Nepal are Pennsylvania German (12.2%, a difference of 0.050%), Immigrants from Fiji (12.2%, a difference of 0.13%), Ethiopian (12.2%, a difference of 0.13%), Taiwanese (12.2%, a difference of 0.15%), and Immigrants from Ethiopia (12.2%, a difference of 0.18%).
| Demographics | Rating | Rank | Poverty |
| Immigrants | Northern Africa | 63.9 /100 | #153 | Good 12.1% |
| Guamanians/Chamorros | 63.9 /100 | #154 | Good 12.1% |
| Hungarians | 63.6 /100 | #155 | Good 12.2% |
| Scotch-Irish | 62.6 /100 | #156 | Good 12.2% |
| Costa Ricans | 62.2 /100 | #157 | Good 12.2% |
| Taiwanese | 61.8 /100 | #158 | Good 12.2% |
| Pennsylvania Germans | 60.8 /100 | #159 | Good 12.2% |
| Immigrants | Nepal | 60.4 /100 | #160 | Good 12.2% |
| Immigrants | Fiji | 59.1 /100 | #161 | Average 12.2% |
| Ethiopians | 59.1 /100 | #162 | Average 12.2% |
| Immigrants | Ethiopia | 58.6 /100 | #163 | Average 12.2% |
| Colombians | 57.8 /100 | #164 | Average 12.2% |
| Immigrants | Albania | 57.7 /100 | #165 | Average 12.2% |
| Venezuelans | 56.9 /100 | #166 | Average 12.2% |
| Immigrants | Chile | 56.7 /100 | #167 | Average 12.2% |