Chinese vs Immigrants from Greece Single Father Poverty
COMPARE
Chinese
Immigrants from Greece
Single Father Poverty
Single Father Poverty Comparison
Chinese
Immigrants from Greece
15.4%
SINGLE FATHER POVERTY
99.3/ 100
METRIC RATING
83rd/ 347
METRIC RANK
16.7%
SINGLE FATHER POVERTY
8.1/ 100
METRIC RATING
221st/ 347
METRIC RANK
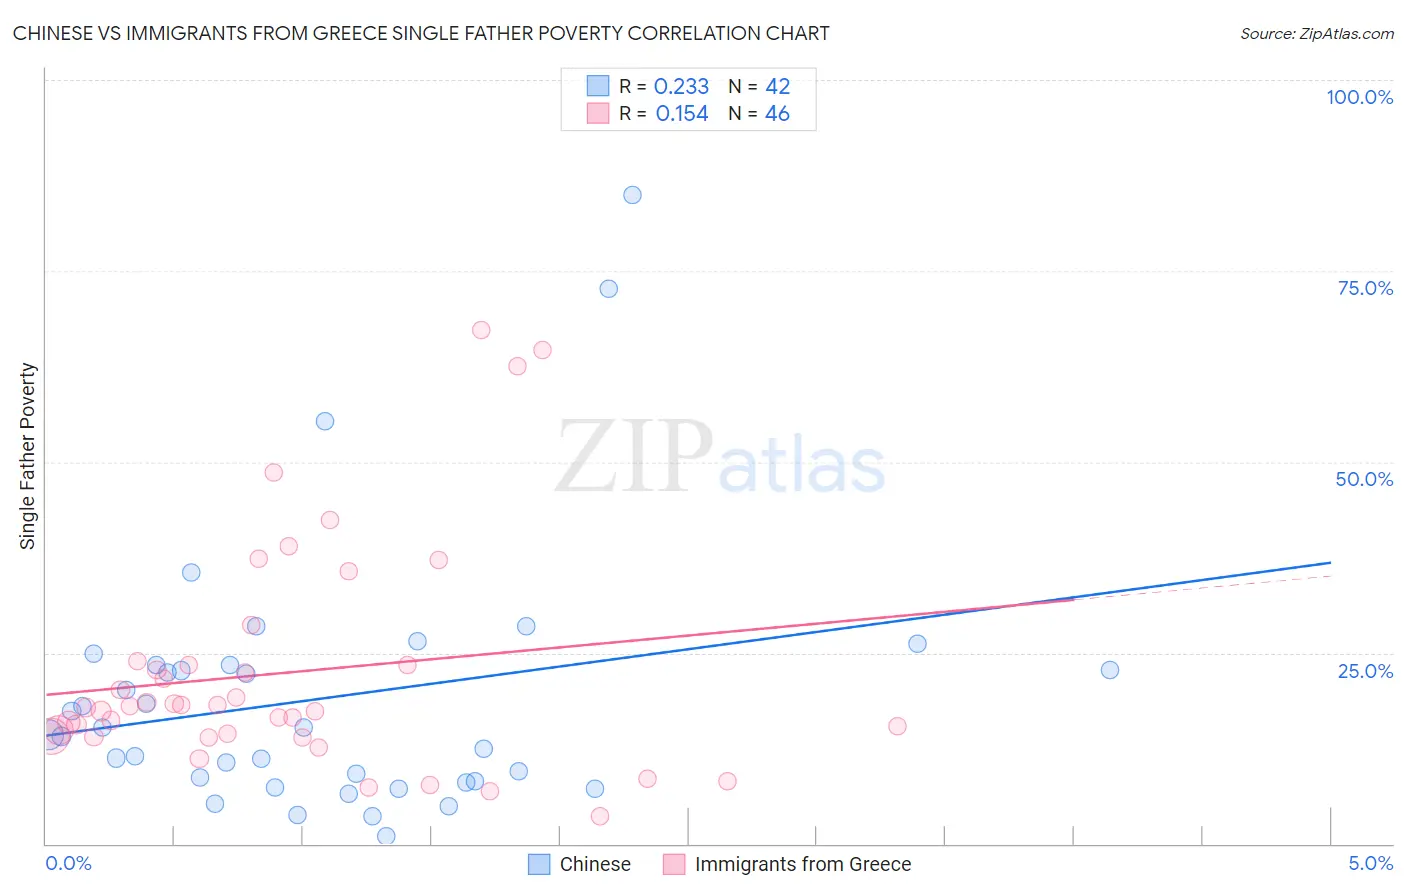
Chinese vs Immigrants from Greece Single Father Poverty Correlation Chart
The statistical analysis conducted on geographies consisting of 60,120,579 people shows a weak positive correlation between the proportion of Chinese and poverty level among single fathers in the United States with a correlation coefficient (R) of 0.233 and weighted average of 15.4%. Similarly, the statistical analysis conducted on geographies consisting of 176,789,916 people shows a poor positive correlation between the proportion of Immigrants from Greece and poverty level among single fathers in the United States with a correlation coefficient (R) of 0.154 and weighted average of 16.7%, a difference of 8.6%.
Single Father Poverty Correlation Summary
| Measurement | Chinese | Immigrants from Greece |
| Minimum | 0.92% | 3.6% |
| Maximum | 85.0% | 67.2% |
| Range | 84.1% | 63.7% |
| Mean | 19.0% | 22.4% |
| Median | 14.7% | 18.0% |
| Interquartile 25% (IQ1) | 8.1% | 14.1% |
| Interquartile 75% (IQ3) | 23.5% | 23.4% |
| Interquartile Range (IQR) | 15.4% | 9.4% |
| Standard Deviation (Sample) | 17.0% | 14.8% |
| Standard Deviation (Population) | 16.8% | 14.7% |
Similar Demographics by Single Father Poverty
Demographics Similar to Chinese by Single Father Poverty
In terms of single father poverty, the demographic groups most similar to Chinese are Immigrants from Ukraine (15.4%, a difference of 0.090%), Immigrants from Congo (15.4%, a difference of 0.10%), Armenian (15.4%, a difference of 0.12%), Peruvian (15.4%, a difference of 0.14%), and Immigrants from Oceania (15.4%, a difference of 0.25%).
| Demographics | Rating | Rank | Single Father Poverty |
| Immigrants | Japan | 99.5 /100 | #76 | Exceptional 15.3% |
| Immigrants | Peru | 99.5 /100 | #77 | Exceptional 15.3% |
| Tlingit-Haida | 99.5 /100 | #78 | Exceptional 15.3% |
| Immigrants | Northern Africa | 99.5 /100 | #79 | Exceptional 15.3% |
| Armenians | 99.4 /100 | #80 | Exceptional 15.4% |
| Immigrants | Congo | 99.4 /100 | #81 | Exceptional 15.4% |
| Immigrants | Ukraine | 99.4 /100 | #82 | Exceptional 15.4% |
| Chinese | 99.3 /100 | #83 | Exceptional 15.4% |
| Peruvians | 99.2 /100 | #84 | Exceptional 15.4% |
| Immigrants | Oceania | 99.1 /100 | #85 | Exceptional 15.4% |
| Immigrants | Russia | 99.0 /100 | #86 | Exceptional 15.5% |
| Brazilians | 99.0 /100 | #87 | Exceptional 15.5% |
| Burmese | 99.0 /100 | #88 | Exceptional 15.5% |
| Immigrants | Korea | 99.0 /100 | #89 | Exceptional 15.5% |
| Mexican American Indians | 98.7 /100 | #90 | Exceptional 15.5% |
Demographics Similar to Immigrants from Greece by Single Father Poverty
In terms of single father poverty, the demographic groups most similar to Immigrants from Greece are Immigrants from Denmark (16.7%, a difference of 0.0%), Immigrants from Ghana (16.7%, a difference of 0.010%), Immigrants from Spain (16.7%, a difference of 0.010%), Immigrants from Uganda (16.7%, a difference of 0.070%), and Cheyenne (16.7%, a difference of 0.17%).
| Demographics | Rating | Rank | Single Father Poverty |
| Spanish | 10.7 /100 | #214 | Poor 16.7% |
| Immigrants | Scotland | 9.6 /100 | #215 | Tragic 16.7% |
| Immigrants | England | 9.5 /100 | #216 | Tragic 16.7% |
| Cheyenne | 9.3 /100 | #217 | Tragic 16.7% |
| Immigrants | Uganda | 8.6 /100 | #218 | Tragic 16.7% |
| Immigrants | Ghana | 8.1 /100 | #219 | Tragic 16.7% |
| Immigrants | Denmark | 8.1 /100 | #220 | Tragic 16.7% |
| Immigrants | Greece | 8.1 /100 | #221 | Tragic 16.7% |
| Immigrants | Spain | 8.0 /100 | #222 | Tragic 16.7% |
| Immigrants | Austria | 7.0 /100 | #223 | Tragic 16.8% |
| Immigrants | Norway | 6.5 /100 | #224 | Tragic 16.8% |
| Menominee | 6.4 /100 | #225 | Tragic 16.8% |
| Hispanics or Latinos | 6.1 /100 | #226 | Tragic 16.8% |
| British | 5.6 /100 | #227 | Tragic 16.8% |
| Belgians | 5.3 /100 | #228 | Tragic 16.8% |