Chinese vs Immigrants from Fiji Female Poverty
COMPARE
Chinese
Immigrants from Fiji
Female Poverty
Female Poverty Comparison
Chinese
Immigrants from Fiji
10.4%
FEMALE POVERTY
100.0/ 100
METRIC RATING
2nd/ 347
METRIC RANK
13.2%
FEMALE POVERTY
71.0/ 100
METRIC RATING
153rd/ 347
METRIC RANK
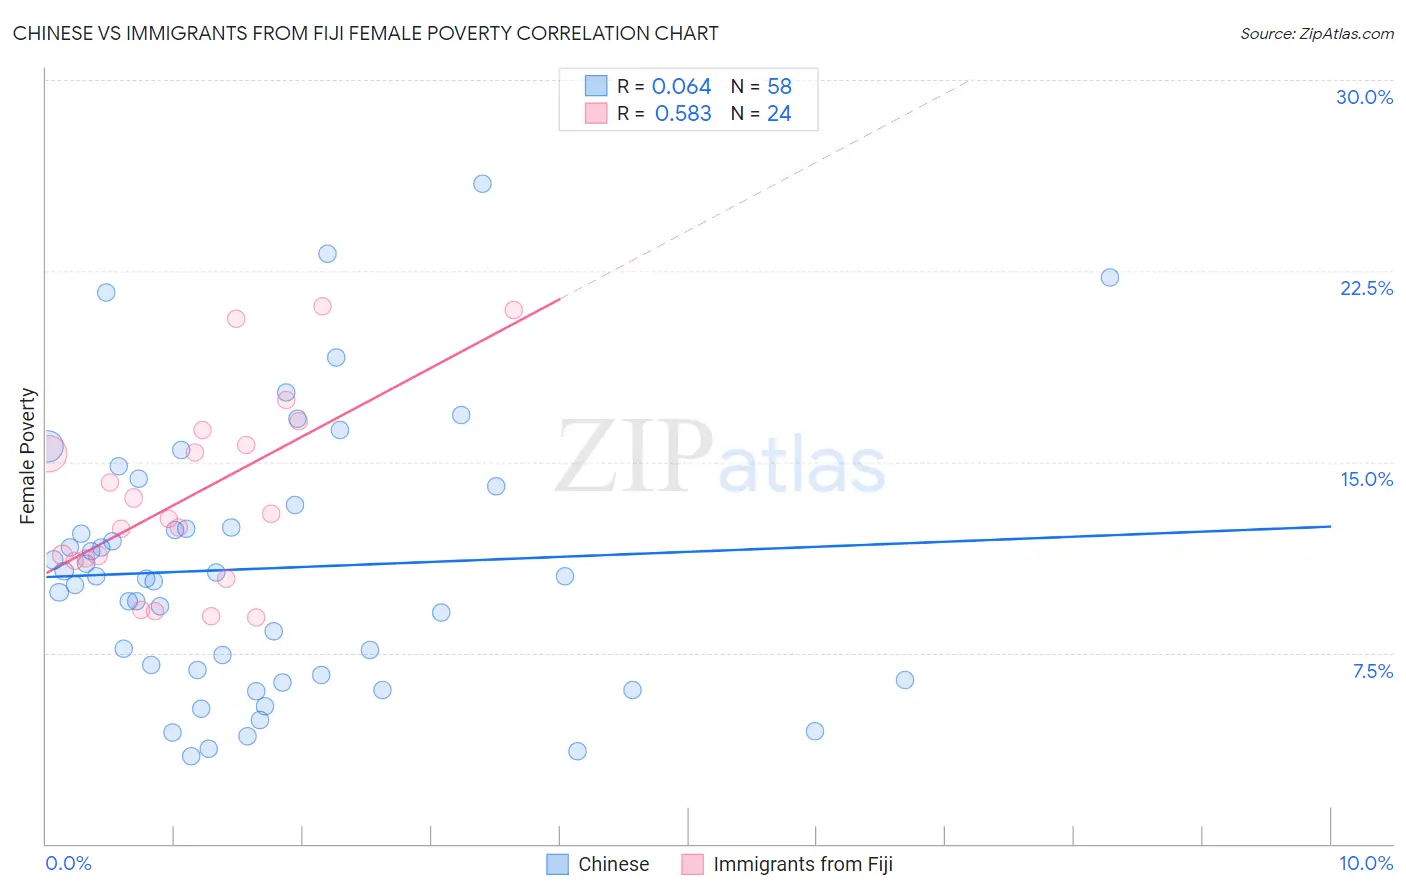
Chinese vs Immigrants from Fiji Female Poverty Correlation Chart
The statistical analysis conducted on geographies consisting of 64,802,428 people shows a slight positive correlation between the proportion of Chinese and poverty level among females in the United States with a correlation coefficient (R) of 0.064 and weighted average of 10.4%. Similarly, the statistical analysis conducted on geographies consisting of 93,754,712 people shows a substantial positive correlation between the proportion of Immigrants from Fiji and poverty level among females in the United States with a correlation coefficient (R) of 0.583 and weighted average of 13.2%, a difference of 26.6%.
Female Poverty Correlation Summary
| Measurement | Chinese | Immigrants from Fiji |
| Minimum | 3.4% | 8.9% |
| Maximum | 25.9% | 21.1% |
| Range | 22.5% | 12.2% |
| Mean | 10.8% | 13.7% |
| Median | 10.4% | 12.9% |
| Interquartile 25% (IQ1) | 6.6% | 11.2% |
| Interquartile 75% (IQ3) | 13.3% | 16.0% |
| Interquartile Range (IQR) | 6.7% | 4.8% |
| Standard Deviation (Sample) | 5.2% | 3.7% |
| Standard Deviation (Population) | 5.1% | 3.7% |
Similar Demographics by Female Poverty
Demographics Similar to Chinese by Female Poverty
In terms of female poverty, the demographic groups most similar to Chinese are Thai (10.5%, a difference of 0.65%), Immigrants from Taiwan (10.5%, a difference of 1.4%), Immigrants from India (9.9%, a difference of 5.2%), Filipino (10.9%, a difference of 5.4%), and Immigrants from Ireland (11.0%, a difference of 5.8%).
| Demographics | Rating | Rank | Female Poverty |
| Immigrants | India | 100.0 /100 | #1 | Exceptional 9.9% |
| Chinese | 100.0 /100 | #2 | Exceptional 10.4% |
| Thais | 100.0 /100 | #3 | Exceptional 10.5% |
| Immigrants | Taiwan | 100.0 /100 | #4 | Exceptional 10.5% |
| Filipinos | 100.0 /100 | #5 | Exceptional 10.9% |
| Immigrants | Ireland | 99.9 /100 | #6 | Exceptional 11.0% |
| Assyrians/Chaldeans/Syriacs | 99.9 /100 | #7 | Exceptional 11.0% |
| Immigrants | South Central Asia | 99.9 /100 | #8 | Exceptional 11.1% |
| Bulgarians | 99.9 /100 | #9 | Exceptional 11.1% |
| Immigrants | Hong Kong | 99.9 /100 | #10 | Exceptional 11.2% |
| Maltese | 99.9 /100 | #11 | Exceptional 11.2% |
| Bhutanese | 99.9 /100 | #12 | Exceptional 11.3% |
| Immigrants | Lithuania | 99.9 /100 | #13 | Exceptional 11.3% |
| Lithuanians | 99.8 /100 | #14 | Exceptional 11.4% |
| Latvians | 99.8 /100 | #15 | Exceptional 11.4% |
Demographics Similar to Immigrants from Fiji by Female Poverty
In terms of female poverty, the demographic groups most similar to Immigrants from Fiji are Armenian (13.2%, a difference of 0.070%), Hungarian (13.2%, a difference of 0.10%), Immigrants from Bosnia and Herzegovina (13.2%, a difference of 0.15%), Immigrants from Northern Africa (13.2%, a difference of 0.25%), and Samoan (13.1%, a difference of 0.32%).
| Demographics | Rating | Rank | Female Poverty |
| Immigrants | Peru | 79.1 /100 | #146 | Good 13.0% |
| Immigrants | Kazakhstan | 78.6 /100 | #147 | Good 13.0% |
| Yugoslavians | 76.9 /100 | #148 | Good 13.1% |
| Taiwanese | 75.7 /100 | #149 | Good 13.1% |
| Tsimshian | 75.5 /100 | #150 | Good 13.1% |
| Immigrants | Germany | 74.9 /100 | #151 | Good 13.1% |
| Samoans | 73.6 /100 | #152 | Good 13.1% |
| Immigrants | Fiji | 71.0 /100 | #153 | Good 13.2% |
| Armenians | 70.4 /100 | #154 | Good 13.2% |
| Hungarians | 70.1 /100 | #155 | Good 13.2% |
| Immigrants | Bosnia and Herzegovina | 69.7 /100 | #156 | Good 13.2% |
| Immigrants | Northern Africa | 68.8 /100 | #157 | Good 13.2% |
| Pennsylvania Germans | 67.3 /100 | #158 | Good 13.2% |
| Costa Ricans | 63.6 /100 | #159 | Good 13.3% |
| Immigrants | Nepal | 62.7 /100 | #160 | Good 13.3% |