Cheyenne vs Ugandan Female Poverty Among 25-34 Year Olds
COMPARE
Cheyenne
Ugandan
Female Poverty Among 25-34 Year Olds
Female Poverty Among 25-34 Year Olds Comparison
Cheyenne
Ugandans
19.1%
FEMALE POVERTY AMONG 25-34 YEAR OLDS
0.0/ 100
METRIC RATING
327th/ 347
METRIC RANK
13.4%
FEMALE POVERTY AMONG 25-34 YEAR OLDS
64.1/ 100
METRIC RATING
162nd/ 347
METRIC RANK
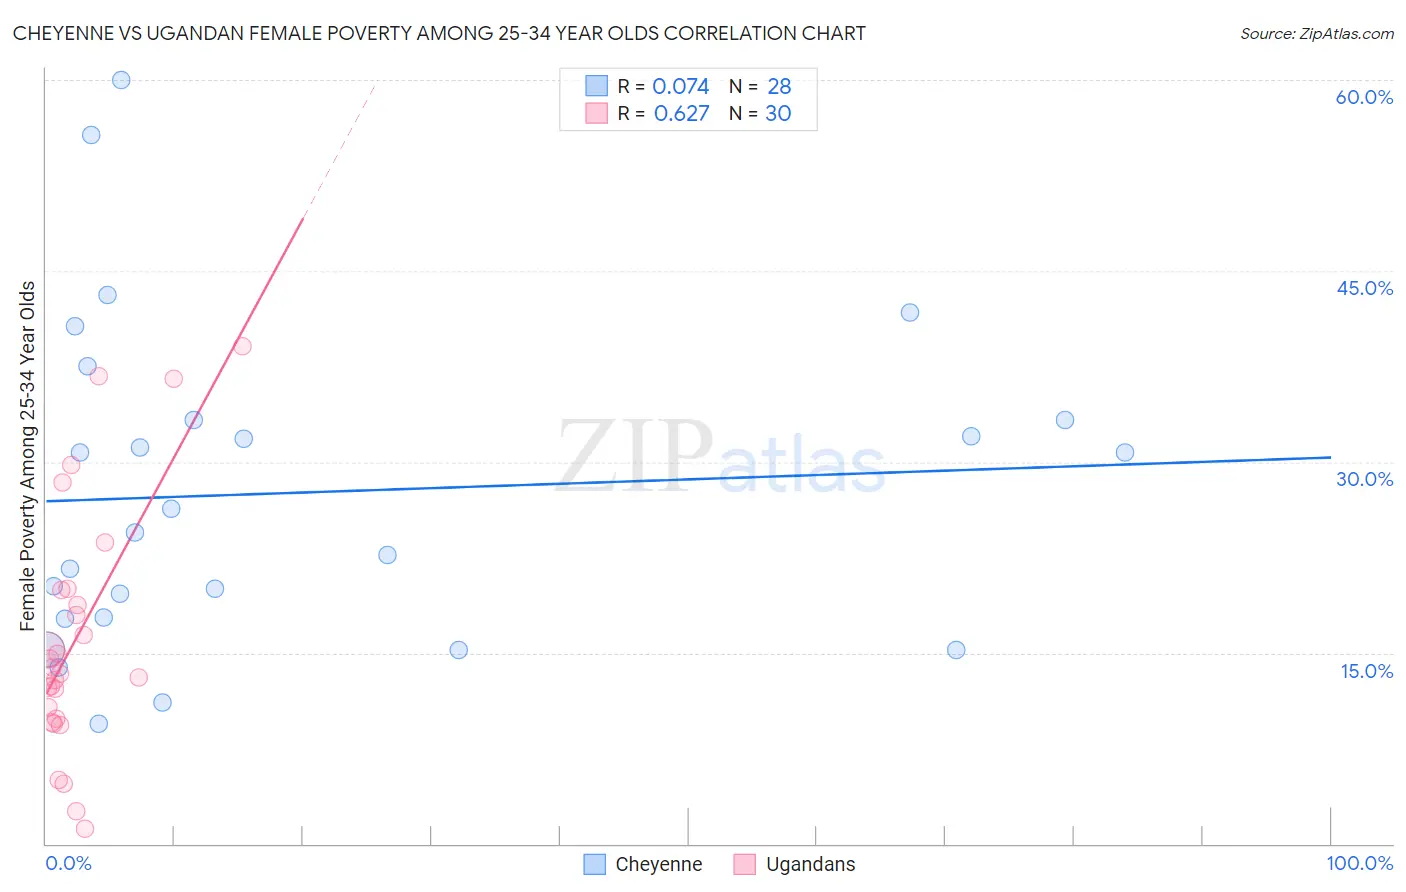
Cheyenne vs Ugandan Female Poverty Among 25-34 Year Olds Correlation Chart
The statistical analysis conducted on geographies consisting of 80,457,436 people shows a slight positive correlation between the proportion of Cheyenne and poverty level among females between the ages 25 and 34 in the United States with a correlation coefficient (R) of 0.074 and weighted average of 19.1%. Similarly, the statistical analysis conducted on geographies consisting of 93,638,275 people shows a significant positive correlation between the proportion of Ugandans and poverty level among females between the ages 25 and 34 in the United States with a correlation coefficient (R) of 0.627 and weighted average of 13.4%, a difference of 42.8%.
Female Poverty Among 25-34 Year Olds Correlation Summary
| Measurement | Cheyenne | Ugandan |
| Minimum | 9.4% | 1.2% |
| Maximum | 60.0% | 39.1% |
| Range | 50.6% | 38.0% |
| Mean | 27.6% | 16.1% |
| Median | 25.4% | 13.6% |
| Interquartile 25% (IQ1) | 17.7% | 9.9% |
| Interquartile 75% (IQ3) | 33.3% | 19.9% |
| Interquartile Range (IQR) | 15.6% | 10.0% |
| Standard Deviation (Sample) | 12.7% | 9.7% |
| Standard Deviation (Population) | 12.5% | 9.6% |
Similar Demographics by Female Poverty Among 25-34 Year Olds
Demographics Similar to Cheyenne by Female Poverty Among 25-34 Year Olds
In terms of female poverty among 25-34 year olds, the demographic groups most similar to Cheyenne are Alaskan Athabascan (19.1%, a difference of 0.080%), Creek (19.2%, a difference of 0.33%), Black/African American (18.9%, a difference of 0.96%), Paiute (19.6%, a difference of 2.6%), and Kiowa (19.7%, a difference of 3.0%).
| Demographics | Rating | Rank | Female Poverty Among 25-34 Year Olds |
| Chippewa | 0.0 /100 | #320 | Tragic 18.0% |
| Choctaw | 0.0 /100 | #321 | Tragic 18.1% |
| Central American Indians | 0.0 /100 | #322 | Tragic 18.2% |
| Seminole | 0.0 /100 | #323 | Tragic 18.3% |
| Dutch West Indians | 0.0 /100 | #324 | Tragic 18.4% |
| Inupiat | 0.0 /100 | #325 | Tragic 18.5% |
| Blacks/African Americans | 0.0 /100 | #326 | Tragic 18.9% |
| Cheyenne | 0.0 /100 | #327 | Tragic 19.1% |
| Alaskan Athabascans | 0.0 /100 | #328 | Tragic 19.1% |
| Creek | 0.0 /100 | #329 | Tragic 19.2% |
| Paiute | 0.0 /100 | #330 | Tragic 19.6% |
| Kiowa | 0.0 /100 | #331 | Tragic 19.7% |
| Immigrants | Yemen | 0.0 /100 | #332 | Tragic 19.8% |
| Cajuns | 0.0 /100 | #333 | Tragic 19.9% |
| Apache | 0.0 /100 | #334 | Tragic 20.1% |
Demographics Similar to Ugandans by Female Poverty Among 25-34 Year Olds
In terms of female poverty among 25-34 year olds, the demographic groups most similar to Ugandans are British (13.4%, a difference of 0.050%), Icelander (13.3%, a difference of 0.15%), Immigrants from South America (13.3%, a difference of 0.21%), Swiss (13.4%, a difference of 0.21%), and Uruguayan (13.3%, a difference of 0.26%).
| Demographics | Rating | Rank | Female Poverty Among 25-34 Year Olds |
| Immigrants | Sierra Leone | 72.9 /100 | #155 | Good 13.3% |
| Immigrants | Cameroon | 72.0 /100 | #156 | Good 13.3% |
| Immigrants | Western Europe | 70.3 /100 | #157 | Good 13.3% |
| Immigrants | Colombia | 69.2 /100 | #158 | Good 13.3% |
| Uruguayans | 66.9 /100 | #159 | Good 13.3% |
| Immigrants | South America | 66.3 /100 | #160 | Good 13.3% |
| Icelanders | 65.7 /100 | #161 | Good 13.3% |
| Ugandans | 64.1 /100 | #162 | Good 13.4% |
| British | 63.5 /100 | #163 | Good 13.4% |
| Swiss | 61.7 /100 | #164 | Good 13.4% |
| Basques | 59.3 /100 | #165 | Average 13.4% |
| Belgians | 58.9 /100 | #166 | Average 13.4% |
| Immigrants | Bosnia and Herzegovina | 58.6 /100 | #167 | Average 13.4% |
| Immigrants | Afghanistan | 57.7 /100 | #168 | Average 13.4% |
| Samoans | 56.8 /100 | #169 | Average 13.5% |