Cheyenne vs Immigrants from Armenia Family Poverty
COMPARE
Cheyenne
Immigrants from Armenia
Family Poverty
Family Poverty Comparison
Cheyenne
Immigrants from Armenia
14.3%
FAMILY POVERTY
0.0/ 100
METRIC RATING
331st/ 347
METRIC RANK
10.0%
FAMILY POVERTY
3.3/ 100
METRIC RATING
227th/ 347
METRIC RANK
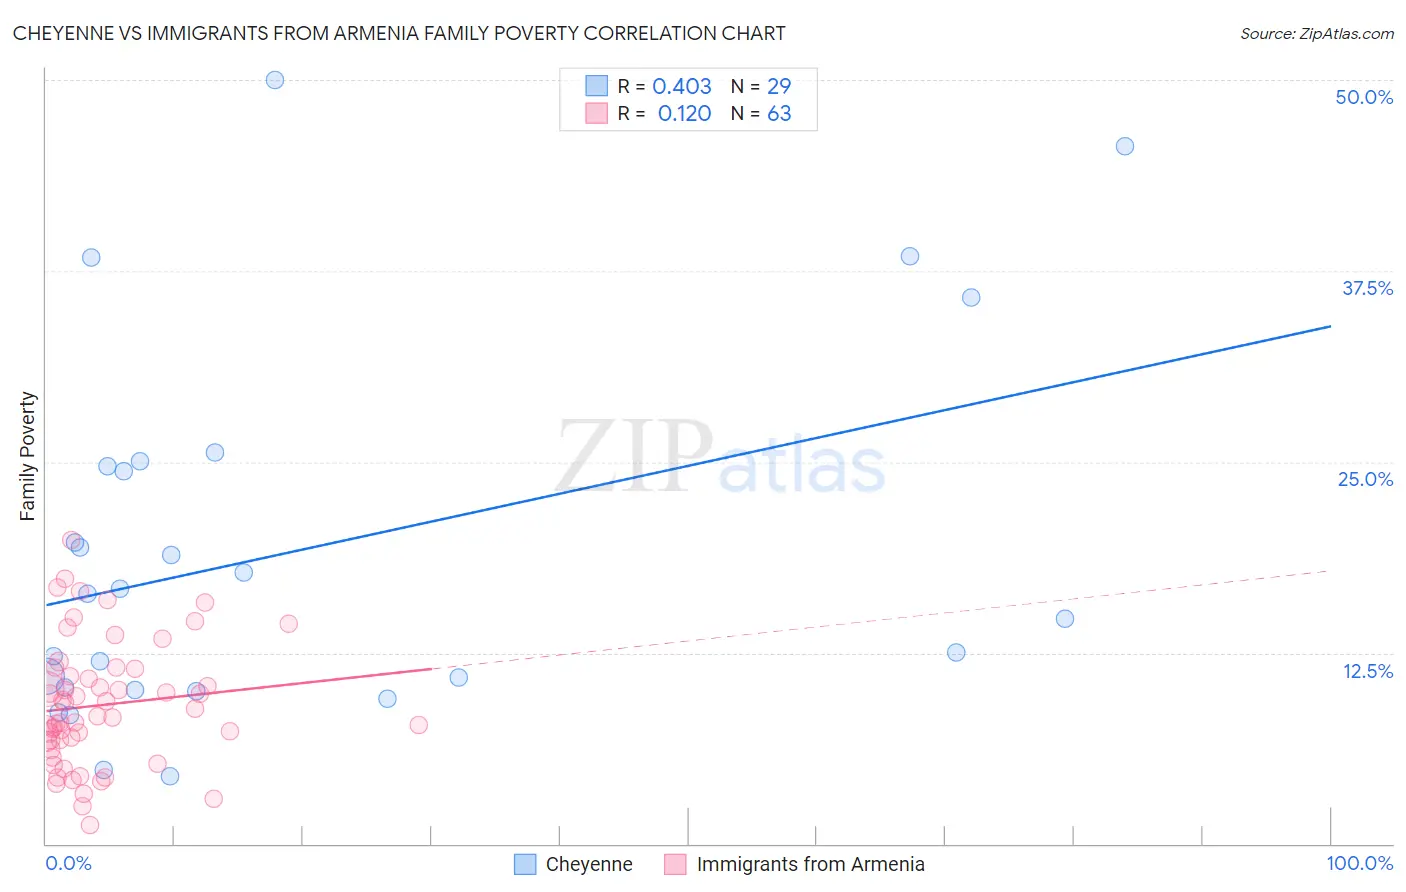
Cheyenne vs Immigrants from Armenia Family Poverty Correlation Chart
The statistical analysis conducted on geographies consisting of 80,652,371 people shows a moderate positive correlation between the proportion of Cheyenne and poverty level among families in the United States with a correlation coefficient (R) of 0.403 and weighted average of 14.3%. Similarly, the statistical analysis conducted on geographies consisting of 97,632,131 people shows a poor positive correlation between the proportion of Immigrants from Armenia and poverty level among families in the United States with a correlation coefficient (R) of 0.120 and weighted average of 10.0%, a difference of 42.8%.
Family Poverty Correlation Summary
| Measurement | Cheyenne | Immigrants from Armenia |
| Minimum | 4.4% | 1.2% |
| Maximum | 50.0% | 19.9% |
| Range | 45.6% | 18.6% |
| Mean | 19.2% | 9.1% |
| Median | 16.4% | 8.3% |
| Interquartile 25% (IQ1) | 10.1% | 6.7% |
| Interquartile 75% (IQ3) | 24.9% | 11.5% |
| Interquartile Range (IQR) | 14.7% | 4.8% |
| Standard Deviation (Sample) | 12.1% | 4.1% |
| Standard Deviation (Population) | 11.9% | 4.0% |
Similar Demographics by Family Poverty
Demographics Similar to Cheyenne by Family Poverty
In terms of family poverty, the demographic groups most similar to Cheyenne are Native/Alaskan (14.3%, a difference of 0.14%), Dominican (14.3%, a difference of 0.44%), Immigrants from Dominican Republic (14.4%, a difference of 1.1%), Houma (14.6%, a difference of 2.4%), and Apache (14.7%, a difference of 3.2%).
| Demographics | Rating | Rank | Family Poverty |
| Immigrants | Dominica | 0.0 /100 | #324 | Tragic 12.7% |
| Paiute | 0.0 /100 | #325 | Tragic 13.0% |
| Colville | 0.0 /100 | #326 | Tragic 13.0% |
| Yakama | 0.0 /100 | #327 | Tragic 13.1% |
| Central American Indians | 0.0 /100 | #328 | Tragic 13.3% |
| Blacks/African Americans | 0.0 /100 | #329 | Tragic 13.3% |
| Natives/Alaskans | 0.0 /100 | #330 | Tragic 14.3% |
| Cheyenne | 0.0 /100 | #331 | Tragic 14.3% |
| Dominicans | 0.0 /100 | #332 | Tragic 14.3% |
| Immigrants | Dominican Republic | 0.0 /100 | #333 | Tragic 14.4% |
| Houma | 0.0 /100 | #334 | Tragic 14.6% |
| Apache | 0.0 /100 | #335 | Tragic 14.7% |
| Sioux | 0.0 /100 | #336 | Tragic 15.9% |
| Hopi | 0.0 /100 | #337 | Tragic 15.9% |
| Crow | 0.0 /100 | #338 | Tragic 16.1% |
Demographics Similar to Immigrants from Armenia by Family Poverty
In terms of family poverty, the demographic groups most similar to Immigrants from Armenia are Ottawa (10.0%, a difference of 0.020%), Sudanese (10.0%, a difference of 0.20%), Immigrants from Uzbekistan (10.0%, a difference of 0.21%), Immigrants from Panama (10.0%, a difference of 0.23%), and Immigrants (10.0%, a difference of 0.29%).
| Demographics | Rating | Rank | Family Poverty |
| Bermudans | 5.3 /100 | #220 | Tragic 9.9% |
| Immigrants | Cambodia | 4.8 /100 | #221 | Tragic 9.9% |
| Japanese | 4.8 /100 | #222 | Tragic 9.9% |
| Immigrants | Africa | 4.3 /100 | #223 | Tragic 9.9% |
| Marshallese | 3.9 /100 | #224 | Tragic 9.9% |
| Immigrants | Immigrants | 3.6 /100 | #225 | Tragic 10.0% |
| Ottawa | 3.3 /100 | #226 | Tragic 10.0% |
| Immigrants | Armenia | 3.3 /100 | #227 | Tragic 10.0% |
| Sudanese | 3.1 /100 | #228 | Tragic 10.0% |
| Immigrants | Uzbekistan | 3.1 /100 | #229 | Tragic 10.0% |
| Immigrants | Panama | 3.1 /100 | #230 | Tragic 10.0% |
| Alaskan Athabascans | 2.7 /100 | #231 | Tragic 10.1% |
| Immigrants | Sudan | 2.3 /100 | #232 | Tragic 10.1% |
| Fijians | 2.1 /100 | #233 | Tragic 10.1% |
| Immigrants | Middle Africa | 2.1 /100 | #234 | Tragic 10.1% |