Cheyenne vs English Single Father Poverty
COMPARE
Cheyenne
English
Single Father Poverty
Single Father Poverty Comparison
Cheyenne
English
16.7%
SINGLE FATHER POVERTY
9.3/ 100
METRIC RATING
217th/ 347
METRIC RANK
17.8%
SINGLE FATHER POVERTY
0.0/ 100
METRIC RATING
281st/ 347
METRIC RANK
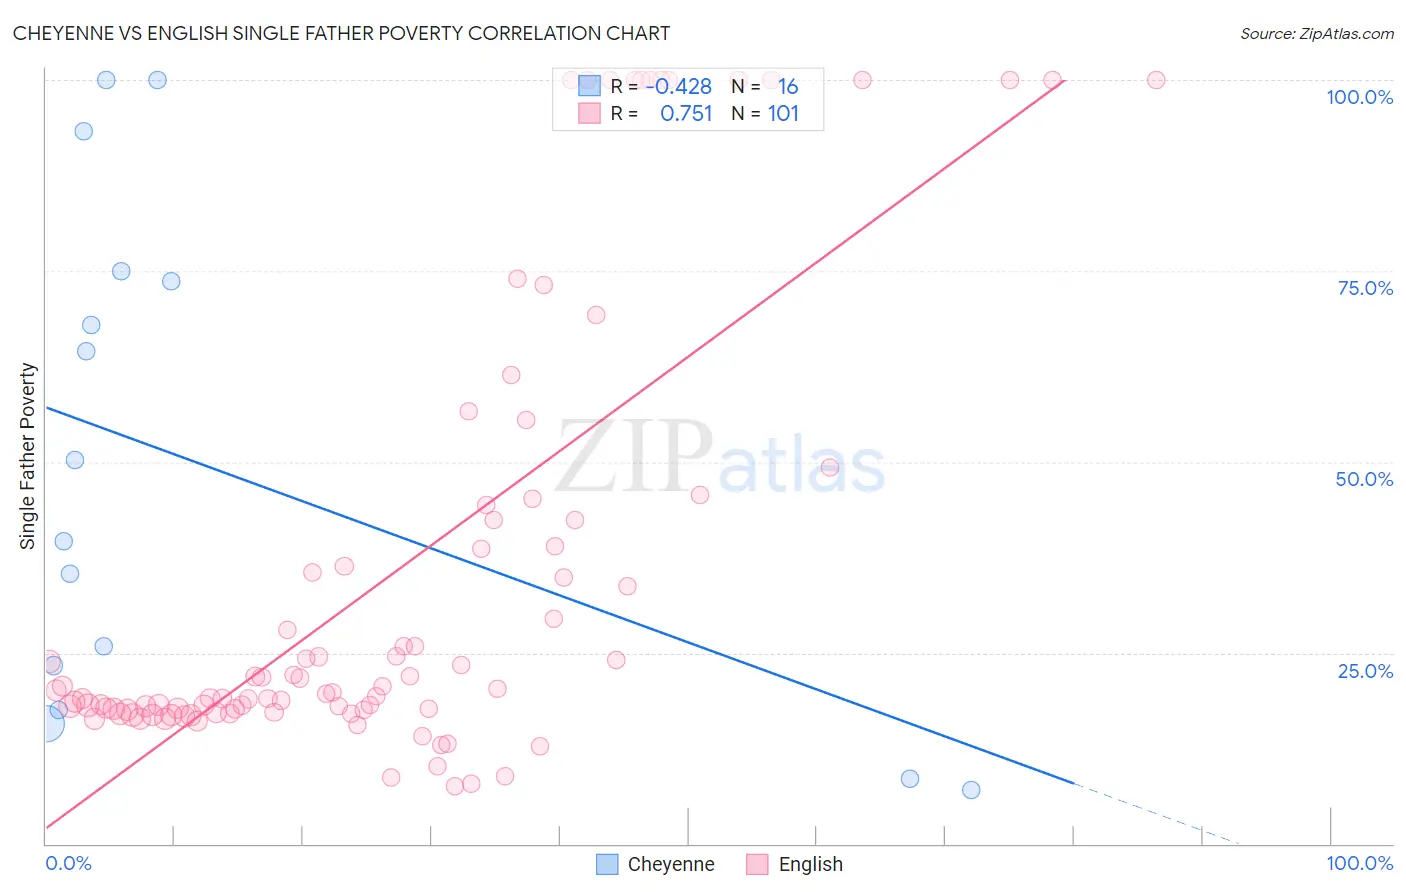
Cheyenne vs English Single Father Poverty Correlation Chart
The statistical analysis conducted on geographies consisting of 74,941,961 people shows a moderate negative correlation between the proportion of Cheyenne and poverty level among single fathers in the United States with a correlation coefficient (R) of -0.428 and weighted average of 16.7%. Similarly, the statistical analysis conducted on geographies consisting of 411,111,316 people shows a strong positive correlation between the proportion of English and poverty level among single fathers in the United States with a correlation coefficient (R) of 0.751 and weighted average of 17.8%, a difference of 6.6%.
Single Father Poverty Correlation Summary
| Measurement | Cheyenne | English |
| Minimum | 7.0% | 7.6% |
| Maximum | 100.0% | 100.0% |
| Range | 93.0% | 92.4% |
| Mean | 49.9% | 35.1% |
| Median | 45.0% | 20.1% |
| Interquartile 25% (IQ1) | 20.4% | 17.5% |
| Interquartile 75% (IQ3) | 74.3% | 42.4% |
| Interquartile Range (IQR) | 53.9% | 24.9% |
| Standard Deviation (Sample) | 32.7% | 29.3% |
| Standard Deviation (Population) | 31.6% | 29.1% |
Similar Demographics by Single Father Poverty
Demographics Similar to Cheyenne by Single Father Poverty
In terms of single father poverty, the demographic groups most similar to Cheyenne are Immigrants from Scotland (16.7%, a difference of 0.030%), Immigrants from England (16.7%, a difference of 0.030%), Immigrants from Uganda (16.7%, a difference of 0.10%), Immigrants from Ghana (16.7%, a difference of 0.16%), and Spanish (16.7%, a difference of 0.17%).
| Demographics | Rating | Rank | Single Father Poverty |
| Guatemalans | 12.9 /100 | #210 | Poor 16.6% |
| Arabs | 12.8 /100 | #211 | Poor 16.6% |
| Immigrants | Southern Europe | 11.2 /100 | #212 | Poor 16.7% |
| Ghanaians | 11.0 /100 | #213 | Poor 16.7% |
| Spanish | 10.7 /100 | #214 | Poor 16.7% |
| Immigrants | Scotland | 9.6 /100 | #215 | Tragic 16.7% |
| Immigrants | England | 9.5 /100 | #216 | Tragic 16.7% |
| Cheyenne | 9.3 /100 | #217 | Tragic 16.7% |
| Immigrants | Uganda | 8.6 /100 | #218 | Tragic 16.7% |
| Immigrants | Ghana | 8.1 /100 | #219 | Tragic 16.7% |
| Immigrants | Denmark | 8.1 /100 | #220 | Tragic 16.7% |
| Immigrants | Greece | 8.1 /100 | #221 | Tragic 16.7% |
| Immigrants | Spain | 8.0 /100 | #222 | Tragic 16.7% |
| Immigrants | Austria | 7.0 /100 | #223 | Tragic 16.8% |
| Immigrants | Norway | 6.5 /100 | #224 | Tragic 16.8% |
Demographics Similar to English by Single Father Poverty
In terms of single father poverty, the demographic groups most similar to English are Dutch (17.8%, a difference of 0.0%), Alsatian (17.8%, a difference of 0.10%), Welsh (17.8%, a difference of 0.12%), Scottish (17.7%, a difference of 0.32%), and Iroquois (17.7%, a difference of 0.37%).
| Demographics | Rating | Rank | Single Father Poverty |
| Macedonians | 0.1 /100 | #274 | Tragic 17.7% |
| British West Indians | 0.0 /100 | #275 | Tragic 17.7% |
| German Russians | 0.0 /100 | #276 | Tragic 17.7% |
| Lebanese | 0.0 /100 | #277 | Tragic 17.7% |
| Germans | 0.0 /100 | #278 | Tragic 17.7% |
| Iroquois | 0.0 /100 | #279 | Tragic 17.7% |
| Scottish | 0.0 /100 | #280 | Tragic 17.7% |
| English | 0.0 /100 | #281 | Tragic 17.8% |
| Dutch | 0.0 /100 | #282 | Tragic 17.8% |
| Alsatians | 0.0 /100 | #283 | Tragic 17.8% |
| Welsh | 0.0 /100 | #284 | Tragic 17.8% |
| Immigrants | Lebanon | 0.0 /100 | #285 | Tragic 17.9% |
| Immigrants | North Macedonia | 0.0 /100 | #286 | Tragic 17.9% |
| Carpatho Rusyns | 0.0 /100 | #287 | Tragic 18.0% |
| Bahamians | 0.0 /100 | #288 | Tragic 18.0% |