Cherokee vs Immigrants from Honduras Female Poverty
COMPARE
Cherokee
Immigrants from Honduras
Female Poverty
Female Poverty Comparison
Cherokee
Immigrants from Honduras
15.6%
FEMALE POVERTY
0.1/ 100
METRIC RATING
263rd/ 347
METRIC RANK
17.7%
FEMALE POVERTY
0.0/ 100
METRIC RATING
324th/ 347
METRIC RANK
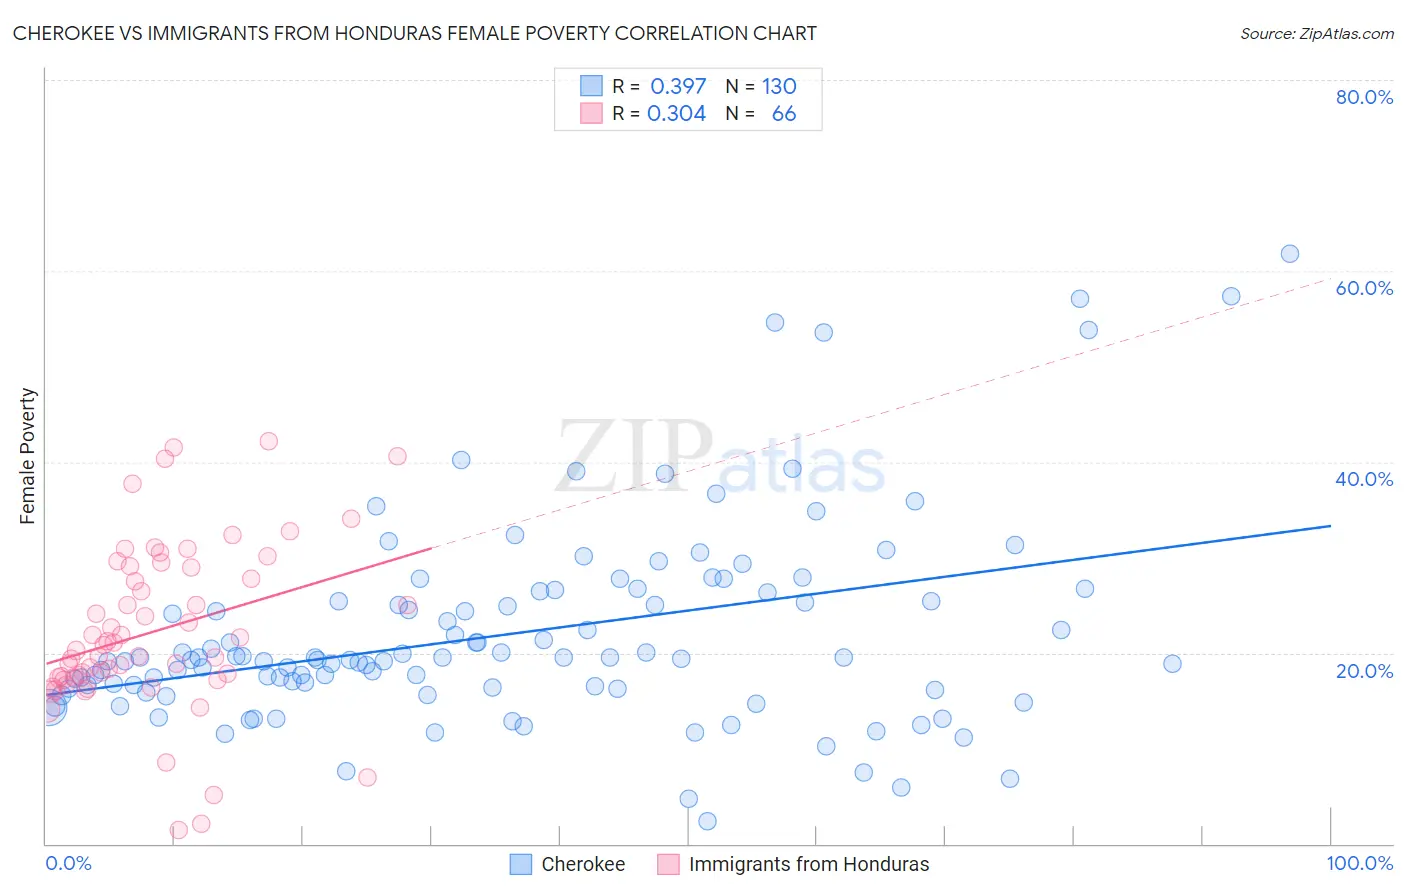
Cherokee vs Immigrants from Honduras Female Poverty Correlation Chart
The statistical analysis conducted on geographies consisting of 493,220,722 people shows a mild positive correlation between the proportion of Cherokee and poverty level among females in the United States with a correlation coefficient (R) of 0.397 and weighted average of 15.6%. Similarly, the statistical analysis conducted on geographies consisting of 322,443,203 people shows a mild positive correlation between the proportion of Immigrants from Honduras and poverty level among females in the United States with a correlation coefficient (R) of 0.304 and weighted average of 17.7%, a difference of 13.6%.
Female Poverty Correlation Summary
| Measurement | Cherokee | Immigrants from Honduras |
| Minimum | 2.3% | 1.4% |
| Maximum | 61.8% | 42.1% |
| Range | 59.5% | 40.7% |
| Mean | 21.9% | 22.2% |
| Median | 19.3% | 20.5% |
| Interquartile 25% (IQ1) | 16.3% | 17.4% |
| Interquartile 75% (IQ3) | 25.5% | 28.9% |
| Interquartile Range (IQR) | 9.2% | 11.5% |
| Standard Deviation (Sample) | 10.5% | 8.7% |
| Standard Deviation (Population) | 10.5% | 8.6% |
Similar Demographics by Female Poverty
Demographics Similar to Cherokee by Female Poverty
In terms of female poverty, the demographic groups most similar to Cherokee are Guyanese (15.6%, a difference of 0.010%), Mexican American Indian (15.6%, a difference of 0.010%), Immigrants from Guyana (15.6%, a difference of 0.11%), Immigrants from Ecuador (15.6%, a difference of 0.13%), and Cape Verdean (15.6%, a difference of 0.19%).
| Demographics | Rating | Rank | Female Poverty |
| Jamaicans | 0.2 /100 | #256 | Tragic 15.5% |
| Immigrants | Jamaica | 0.1 /100 | #257 | Tragic 15.6% |
| Shoshone | 0.1 /100 | #258 | Tragic 15.6% |
| Cape Verdeans | 0.1 /100 | #259 | Tragic 15.6% |
| Immigrants | Guyana | 0.1 /100 | #260 | Tragic 15.6% |
| Guyanese | 0.1 /100 | #261 | Tragic 15.6% |
| Mexican American Indians | 0.1 /100 | #262 | Tragic 15.6% |
| Cherokee | 0.1 /100 | #263 | Tragic 15.6% |
| Immigrants | Ecuador | 0.1 /100 | #264 | Tragic 15.6% |
| Immigrants | Liberia | 0.1 /100 | #265 | Tragic 15.7% |
| Immigrants | El Salvador | 0.1 /100 | #266 | Tragic 15.7% |
| Sub-Saharan Africans | 0.1 /100 | #267 | Tragic 15.8% |
| Immigrants | Nicaragua | 0.1 /100 | #268 | Tragic 15.8% |
| Iroquois | 0.1 /100 | #269 | Tragic 15.8% |
| Chickasaw | 0.1 /100 | #270 | Tragic 15.9% |
Demographics Similar to Immigrants from Honduras by Female Poverty
In terms of female poverty, the demographic groups most similar to Immigrants from Honduras are Colville (17.8%, a difference of 0.15%), Paiute (17.7%, a difference of 0.18%), Menominee (17.6%, a difference of 0.77%), Arapaho (17.5%, a difference of 1.4%), and Immigrants from Dominica (17.5%, a difference of 1.5%).
| Demographics | Rating | Rank | Female Poverty |
| Immigrants | Congo | 0.0 /100 | #317 | Tragic 17.4% |
| Ute | 0.0 /100 | #318 | Tragic 17.5% |
| Cajuns | 0.0 /100 | #319 | Tragic 17.5% |
| Immigrants | Dominica | 0.0 /100 | #320 | Tragic 17.5% |
| Arapaho | 0.0 /100 | #321 | Tragic 17.5% |
| Menominee | 0.0 /100 | #322 | Tragic 17.6% |
| Paiute | 0.0 /100 | #323 | Tragic 17.7% |
| Immigrants | Honduras | 0.0 /100 | #324 | Tragic 17.7% |
| Colville | 0.0 /100 | #325 | Tragic 17.8% |
| Central American Indians | 0.0 /100 | #326 | Tragic 18.0% |
| Yakama | 0.0 /100 | #327 | Tragic 18.0% |
| Blacks/African Americans | 0.0 /100 | #328 | Tragic 18.6% |
| Kiowa | 0.0 /100 | #329 | Tragic 18.6% |
| Dominicans | 0.0 /100 | #330 | Tragic 19.1% |
| Natives/Alaskans | 0.0 /100 | #331 | Tragic 19.2% |