Cherokee vs Immigrants from Africa Single Male Poverty
COMPARE
Cherokee
Immigrants from Africa
Single Male Poverty
Single Male Poverty Comparison
Cherokee
Immigrants from Africa
16.1%
SINGLE MALE POVERTY
0.0/ 100
METRIC RATING
313th/ 347
METRIC RANK
12.7%
SINGLE MALE POVERTY
63.4/ 100
METRIC RATING
161st/ 347
METRIC RANK
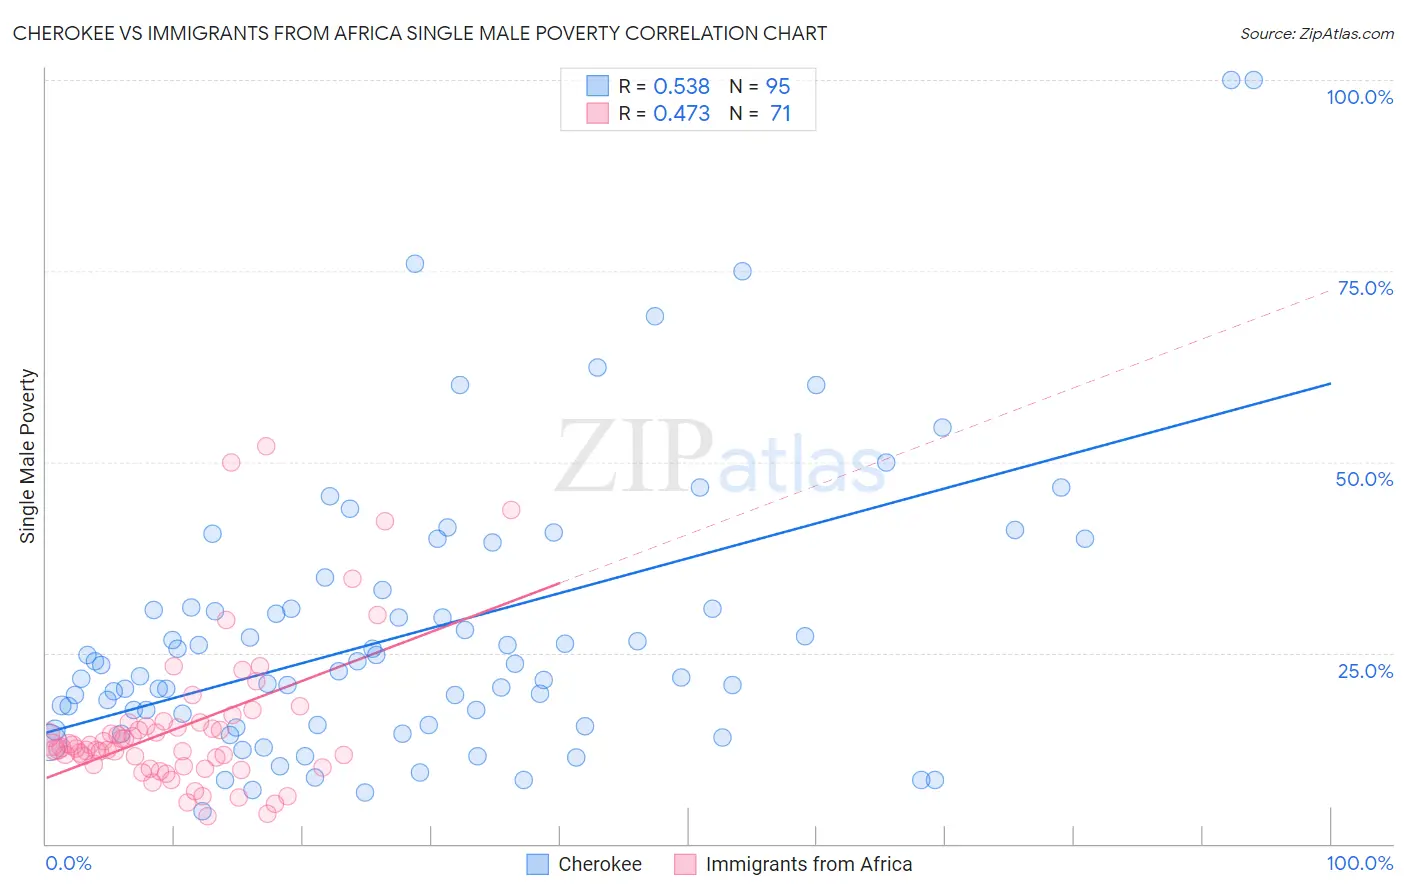
Cherokee vs Immigrants from Africa Single Male Poverty Correlation Chart
The statistical analysis conducted on geographies consisting of 428,758,235 people shows a substantial positive correlation between the proportion of Cherokee and poverty level among single males in the United States with a correlation coefficient (R) of 0.538 and weighted average of 16.1%. Similarly, the statistical analysis conducted on geographies consisting of 408,321,289 people shows a moderate positive correlation between the proportion of Immigrants from Africa and poverty level among single males in the United States with a correlation coefficient (R) of 0.473 and weighted average of 12.7%, a difference of 26.4%.
Single Male Poverty Correlation Summary
| Measurement | Cherokee | Immigrants from Africa |
| Minimum | 4.3% | 3.6% |
| Maximum | 100.0% | 52.0% |
| Range | 95.7% | 48.4% |
| Mean | 27.7% | 15.3% |
| Median | 22.6% | 12.6% |
| Interquartile 25% (IQ1) | 15.5% | 10.1% |
| Interquartile 75% (IQ3) | 30.9% | 15.8% |
| Interquartile Range (IQR) | 15.4% | 5.7% |
| Standard Deviation (Sample) | 18.5% | 9.6% |
| Standard Deviation (Population) | 18.4% | 9.6% |
Similar Demographics by Single Male Poverty
Demographics Similar to Cherokee by Single Male Poverty
In terms of single male poverty, the demographic groups most similar to Cherokee are Seminole (16.0%, a difference of 0.23%), Comanche (16.0%, a difference of 0.23%), Alaskan Athabascan (16.1%, a difference of 0.29%), Cheyenne (16.1%, a difference of 0.33%), and Dutch West Indian (16.1%, a difference of 0.48%).
| Demographics | Rating | Rank | Single Male Poverty |
| Pennsylvania Germans | 0.0 /100 | #306 | Tragic 15.6% |
| Ute | 0.0 /100 | #307 | Tragic 15.7% |
| Potawatomi | 0.0 /100 | #308 | Tragic 15.8% |
| Americans | 0.0 /100 | #309 | Tragic 15.8% |
| Yakama | 0.0 /100 | #310 | Tragic 15.9% |
| Seminole | 0.0 /100 | #311 | Tragic 16.0% |
| Comanche | 0.0 /100 | #312 | Tragic 16.0% |
| Cherokee | 0.0 /100 | #313 | Tragic 16.1% |
| Alaskan Athabascans | 0.0 /100 | #314 | Tragic 16.1% |
| Cheyenne | 0.0 /100 | #315 | Tragic 16.1% |
| Dutch West Indians | 0.0 /100 | #316 | Tragic 16.1% |
| Blacks/African Americans | 0.0 /100 | #317 | Tragic 16.2% |
| Chickasaw | 0.0 /100 | #318 | Tragic 16.3% |
| Chippewa | 0.0 /100 | #319 | Tragic 16.4% |
| Marshallese | 0.0 /100 | #320 | Tragic 16.4% |
Demographics Similar to Immigrants from Africa by Single Male Poverty
In terms of single male poverty, the demographic groups most similar to Immigrants from Africa are Eastern European (12.7%, a difference of 0.010%), Palestinian (12.7%, a difference of 0.020%), Immigrants from Nigeria (12.7%, a difference of 0.030%), Immigrants from Liberia (12.7%, a difference of 0.040%), and Greek (12.7%, a difference of 0.040%).
| Demographics | Rating | Rank | Single Male Poverty |
| Immigrants | Scotland | 68.9 /100 | #154 | Good 12.7% |
| Immigrants | Spain | 68.7 /100 | #155 | Good 12.7% |
| Vietnamese | 67.9 /100 | #156 | Good 12.7% |
| Latvians | 67.9 /100 | #157 | Good 12.7% |
| Immigrants | Middle Africa | 64.9 /100 | #158 | Good 12.7% |
| Immigrants | Liberia | 64.2 /100 | #159 | Good 12.7% |
| Greeks | 64.1 /100 | #160 | Good 12.7% |
| Immigrants | Africa | 63.4 /100 | #161 | Good 12.7% |
| Eastern Europeans | 63.3 /100 | #162 | Good 12.7% |
| Palestinians | 63.1 /100 | #163 | Good 12.7% |
| Immigrants | Nigeria | 62.8 /100 | #164 | Good 12.7% |
| Immigrants | Cambodia | 62.2 /100 | #165 | Good 12.7% |
| Immigrants | Guyana | 60.5 /100 | #166 | Good 12.7% |
| Immigrants | Sudan | 58.2 /100 | #167 | Average 12.7% |
| Immigrants | Barbados | 57.7 /100 | #168 | Average 12.7% |