Central American vs Carpatho Rusyn Poverty
COMPARE
Central American
Carpatho Rusyn
Poverty
Poverty Comparison
Central Americans
Carpatho Rusyns
14.6%
POVERTY
0.1/ 100
METRIC RATING
270th/ 347
METRIC RANK
11.3%
POVERTY
97.2/ 100
METRIC RATING
74th/ 347
METRIC RANK
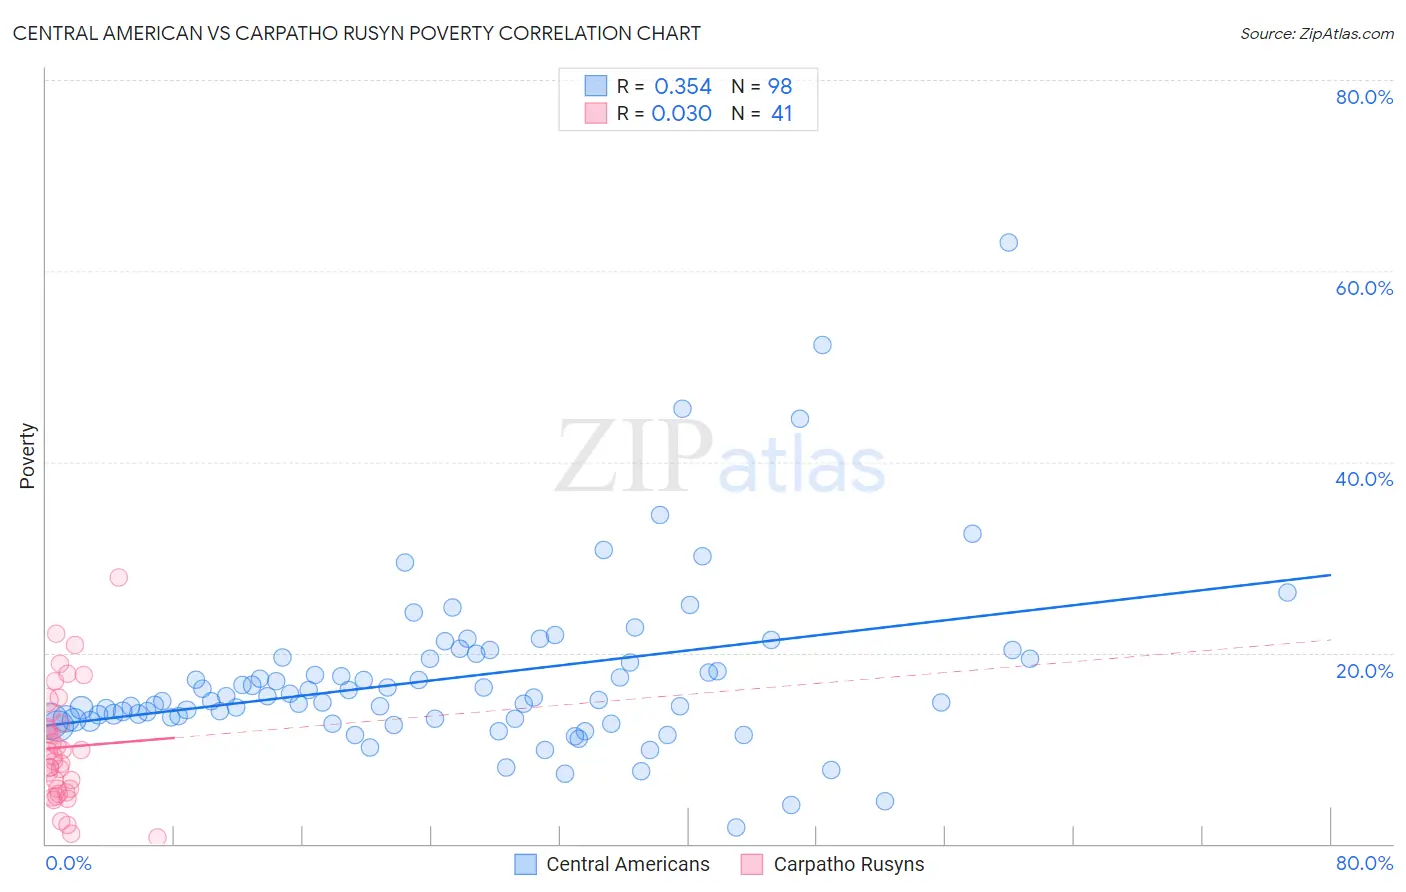
Central American vs Carpatho Rusyn Poverty Correlation Chart
The statistical analysis conducted on geographies consisting of 504,069,914 people shows a mild positive correlation between the proportion of Central Americans and poverty level in the United States with a correlation coefficient (R) of 0.354 and weighted average of 14.6%. Similarly, the statistical analysis conducted on geographies consisting of 58,869,628 people shows no correlation between the proportion of Carpatho Rusyns and poverty level in the United States with a correlation coefficient (R) of 0.030 and weighted average of 11.3%, a difference of 29.5%.
Poverty Correlation Summary
| Measurement | Central American | Carpatho Rusyn |
| Minimum | 1.8% | 0.68% |
| Maximum | 62.9% | 27.9% |
| Range | 61.2% | 27.2% |
| Mean | 17.4% | 10.1% |
| Median | 15.0% | 9.2% |
| Interquartile 25% (IQ1) | 13.0% | 5.6% |
| Interquartile 75% (IQ3) | 19.4% | 13.1% |
| Interquartile Range (IQR) | 6.3% | 7.6% |
| Standard Deviation (Sample) | 9.1% | 6.0% |
| Standard Deviation (Population) | 9.1% | 5.9% |
Similar Demographics by Poverty
Demographics Similar to Central Americans by Poverty
In terms of poverty, the demographic groups most similar to Central Americans are Immigrants from Cuba (14.6%, a difference of 0.14%), Subsaharan African (14.5%, a difference of 0.29%), Iroquois (14.5%, a difference of 0.33%), Shoshone (14.7%, a difference of 0.58%), and Chickasaw (14.7%, a difference of 0.63%).
| Demographics | Rating | Rank | Poverty |
| Jamaicans | 0.1 /100 | #263 | Tragic 14.4% |
| Immigrants | Jamaica | 0.1 /100 | #264 | Tragic 14.4% |
| Immigrants | Guyana | 0.1 /100 | #265 | Tragic 14.5% |
| Guyanese | 0.1 /100 | #266 | Tragic 14.5% |
| Iroquois | 0.1 /100 | #267 | Tragic 14.5% |
| Sub-Saharan Africans | 0.1 /100 | #268 | Tragic 14.5% |
| Immigrants | Cuba | 0.1 /100 | #269 | Tragic 14.6% |
| Central Americans | 0.1 /100 | #270 | Tragic 14.6% |
| Shoshone | 0.0 /100 | #271 | Tragic 14.7% |
| Chickasaw | 0.0 /100 | #272 | Tragic 14.7% |
| Spanish Americans | 0.0 /100 | #273 | Tragic 14.7% |
| Barbadians | 0.0 /100 | #274 | Tragic 14.8% |
| Immigrants | West Indies | 0.0 /100 | #275 | Tragic 14.8% |
| Immigrants | Bahamas | 0.0 /100 | #276 | Tragic 14.8% |
| Bangladeshis | 0.0 /100 | #277 | Tragic 14.8% |
Demographics Similar to Carpatho Rusyns by Poverty
In terms of poverty, the demographic groups most similar to Carpatho Rusyns are European (11.3%, a difference of 0.050%), Immigrants from Belgium (11.3%, a difference of 0.050%), Zimbabwean (11.3%, a difference of 0.070%), Immigrants from Canada (11.3%, a difference of 0.090%), and Serbian (11.2%, a difference of 0.18%).
| Demographics | Rating | Rank | Poverty |
| Immigrants | Australia | 97.4 /100 | #67 | Exceptional 11.2% |
| Slovaks | 97.4 /100 | #68 | Exceptional 11.2% |
| Serbians | 97.4 /100 | #69 | Exceptional 11.2% |
| Immigrants | Canada | 97.3 /100 | #70 | Exceptional 11.3% |
| Zimbabweans | 97.3 /100 | #71 | Exceptional 11.3% |
| Europeans | 97.2 /100 | #72 | Exceptional 11.3% |
| Immigrants | Belgium | 97.2 /100 | #73 | Exceptional 11.3% |
| Carpatho Rusyns | 97.2 /100 | #74 | Exceptional 11.3% |
| Immigrants | Eastern Europe | 97.0 /100 | #75 | Exceptional 11.3% |
| Immigrants | North America | 96.8 /100 | #76 | Exceptional 11.3% |
| Immigrants | Eastern Asia | 96.7 /100 | #77 | Exceptional 11.3% |
| Dutch | 96.7 /100 | #78 | Exceptional 11.3% |
| Cambodians | 96.7 /100 | #79 | Exceptional 11.3% |
| Indians (Asian) | 96.6 /100 | #80 | Exceptional 11.3% |
| Irish | 96.6 /100 | #81 | Exceptional 11.3% |