Central American Indian vs Immigrants from Micronesia Male Poverty
COMPARE
Central American Indian
Immigrants from Micronesia
Male Poverty
Male Poverty Comparison
Central American Indians
Immigrants from Micronesia
15.3%
MALE POVERTY
0.0/ 100
METRIC RATING
326th/ 347
METRIC RANK
12.2%
MALE POVERTY
2.1/ 100
METRIC RATING
223rd/ 347
METRIC RANK
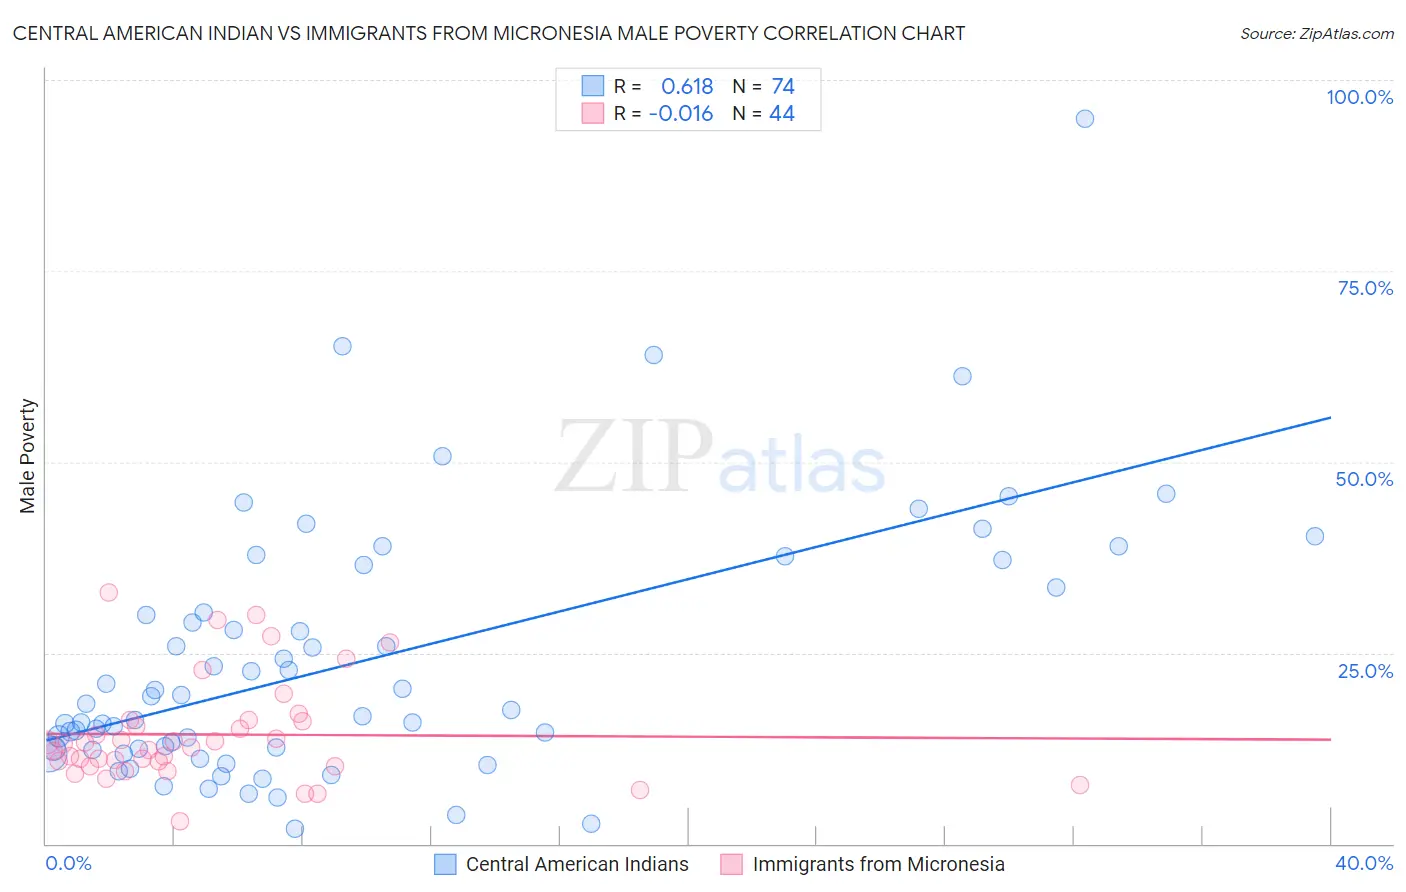
Central American Indian vs Immigrants from Micronesia Male Poverty Correlation Chart
The statistical analysis conducted on geographies consisting of 326,052,023 people shows a significant positive correlation between the proportion of Central American Indians and poverty level among males in the United States with a correlation coefficient (R) of 0.618 and weighted average of 15.3%. Similarly, the statistical analysis conducted on geographies consisting of 61,601,312 people shows no correlation between the proportion of Immigrants from Micronesia and poverty level among males in the United States with a correlation coefficient (R) of -0.016 and weighted average of 12.2%, a difference of 25.2%.
Male Poverty Correlation Summary
| Measurement | Central American Indian | Immigrants from Micronesia |
| Minimum | 1.9% | 3.0% |
| Maximum | 94.9% | 32.9% |
| Range | 93.0% | 29.9% |
| Mean | 23.8% | 14.3% |
| Median | 17.9% | 12.8% |
| Interquartile 25% (IQ1) | 12.5% | 10.5% |
| Interquartile 75% (IQ3) | 33.5% | 16.1% |
| Interquartile Range (IQR) | 21.1% | 5.6% |
| Standard Deviation (Sample) | 16.9% | 6.7% |
| Standard Deviation (Population) | 16.8% | 6.6% |
Similar Demographics by Male Poverty
Demographics Similar to Central American Indians by Male Poverty
In terms of male poverty, the demographic groups most similar to Central American Indians are Yakama (15.3%, a difference of 0.11%), Menominee (15.3%, a difference of 0.29%), Colville (15.2%, a difference of 0.48%), Kiowa (15.2%, a difference of 0.87%), and Arapaho (15.1%, a difference of 1.6%).
| Demographics | Rating | Rank | Male Poverty |
| U.S. Virgin Islanders | 0.0 /100 | #319 | Tragic 14.7% |
| Immigrants | Congo | 0.0 /100 | #320 | Tragic 14.7% |
| Arapaho | 0.0 /100 | #321 | Tragic 15.1% |
| Kiowa | 0.0 /100 | #322 | Tragic 15.2% |
| Colville | 0.0 /100 | #323 | Tragic 15.2% |
| Menominee | 0.0 /100 | #324 | Tragic 15.3% |
| Yakama | 0.0 /100 | #325 | Tragic 15.3% |
| Central American Indians | 0.0 /100 | #326 | Tragic 15.3% |
| Paiute | 0.0 /100 | #327 | Tragic 15.8% |
| Blacks/African Americans | 0.0 /100 | #328 | Tragic 15.8% |
| Dominicans | 0.0 /100 | #329 | Tragic 16.1% |
| Immigrants | Dominican Republic | 0.0 /100 | #330 | Tragic 16.2% |
| Ute | 0.0 /100 | #331 | Tragic 16.2% |
| Houma | 0.0 /100 | #332 | Tragic 16.7% |
| Natives/Alaskans | 0.0 /100 | #333 | Tragic 16.9% |
Demographics Similar to Immigrants from Micronesia by Male Poverty
In terms of male poverty, the demographic groups most similar to Immigrants from Micronesia are Immigrants from Africa (12.2%, a difference of 0.010%), Ugandan (12.2%, a difference of 0.040%), Immigrants from Eritrea (12.2%, a difference of 0.25%), Bermudan (12.2%, a difference of 0.26%), and German Russian (12.2%, a difference of 0.33%).
| Demographics | Rating | Rank | Male Poverty |
| Immigrants | Cambodia | 2.5 /100 | #216 | Tragic 12.2% |
| Immigrants | Thailand | 2.5 /100 | #217 | Tragic 12.2% |
| German Russians | 2.5 /100 | #218 | Tragic 12.2% |
| Bermudans | 2.4 /100 | #219 | Tragic 12.2% |
| Immigrants | Eritrea | 2.4 /100 | #220 | Tragic 12.2% |
| Ugandans | 2.2 /100 | #221 | Tragic 12.2% |
| Immigrants | Africa | 2.1 /100 | #222 | Tragic 12.2% |
| Immigrants | Micronesia | 2.1 /100 | #223 | Tragic 12.2% |
| Immigrants | Nigeria | 1.6 /100 | #224 | Tragic 12.3% |
| Osage | 1.5 /100 | #225 | Tragic 12.3% |
| Nigerians | 1.4 /100 | #226 | Tragic 12.3% |
| Alaska Natives | 1.4 /100 | #227 | Tragic 12.4% |
| Alsatians | 1.3 /100 | #228 | Tragic 12.4% |
| Cubans | 1.3 /100 | #229 | Tragic 12.4% |
| Marshallese | 0.8 /100 | #230 | Tragic 12.5% |