Central American Indian vs Immigrants from Cameroon Seniors Poverty Over the Age of 65

COMPARE

Central American Indian
Race
Ancestry
AfghanAfricanAlaska NativeAlaskan AthabascanAlbanianAleutAlsatianAmericanApacheArabArapahoArgentineanArmenianAssyrian/Chaldean/SyriacAustralianAustrianBahamianBangladeshiBarbadianBasqueBelgianBelizeanBermudanBhutaneseBlackfeetBolivianBrazilianBritishBritish West IndianBulgarianBurmeseCajunCambodianCanadianCape VerdeanCarpatho RusynCelticCentral AmericanCentral American IndianCherokeeCheyenneChickasawChileanChineseChippewaChoctawColombianColvilleComancheCosta RicanCreeCreekCroatianCrowCubanCypriotCzechCzechoslovakianDanishDelawareDominicanDutchDutch West IndianEastern EuropeanEcuadorianEgyptianEnglishEstonianEthiopianEuropeanFijianFilipinoFinnishFrenchFrench American IndianFrench CanadianGermanGerman RussianGhanaianGreekGuamanian/ChamorroGuatemalanGuyaneseHaitianHmongHonduranHopiHoumaHungarianIcelanderIndian (Asian)IndonesianInupiatIranianIraqiIrishIroquoisIsraeliItalianJamaicanJapaneseJordanianKenyanKiowaKoreanLaotianLatvianLebaneseLiberianLithuanianLumbeeLuxembourgerMacedonianMalaysianMalteseMarshalleseMenomineeMexicanMexican American IndianMongolianMoroccanNative HawaiianNavajoNepaleseNew ZealanderNicaraguanNigerianNorthern EuropeanNorwegianOkinawanOsageOttawaPaiutePakistaniPalestinianPanamanianParaguayanPennsylvania GermanPeruvianPimaPolishPortuguesePotawatomiPuebloPuerto RicanPuget Sound SalishRomanianRussianSalvadoranSamoanScandinavianScotch-IrishScottishSeminoleSenegaleseSerbianShoshoneSierra LeoneanSiouxSlavicSlovakSloveneSomaliSouth AfricanSouth AmericanSouth American IndianSoviet UnionSpaniardSpanishSpanish AmericanSpanish American IndianSri LankanSubsaharan AfricanSudaneseSwedishSwissSyrianTaiwaneseThaiTlingit-HaidaTohono O'OdhamTonganTrinidadian and TobagonianTsimshianTurkishU.S. Virgin IslanderUgandanUkrainianUruguayanUteVenezuelanVietnameseWelshWest IndianYakamaYaquiYugoslavianYumanYup'ikZimbabwean
Immigration
NonimmigrantsImmigrantsAfghanistanAfricaAlbaniaArgentinaArmeniaAsiaAustraliaAustriaBahamasBangladeshBarbadosBelarusBelgiumBelizeBoliviaBosnia and HerzegovinaBrazilBulgariaBurma/MyanmarCabo VerdeCambodiaCanadaCaribbeanCentral AmericaChileChinaColombiaCongoCosta RicaCroatiaCubaCzechoslovakiaDenmarkDominicaDominican RepublicEastern AfricaEastern AsiaEastern EuropeEcuadorEgyptEl SalvadorEnglandEritreaEthiopiaEuropeFijiFranceGermanyGhanaGreeceGrenadaGuatemalaGuyanaHaitiHondurasHong KongHungaryIndiaIndonesiaIranIraqIrelandIsraelItalyJamaicaJapanJordanKazakhstanKenyaKoreaKuwaitLaosLatin AmericaLatviaLebanonLiberiaLithuaniaMalaysiaMexicoMicronesiaMiddle AfricaMoldovaMoroccoNepalNetherlandsNicaraguaNigeriaNorth AmericaNorth MacedoniaNorthern AfricaNorthern EuropeNorwayOceaniaPakistanPanamaPeruPhilippinesPolandPortugalRomaniaRussiaSaudi ArabiaScotlandSenegalSerbiaSierra LeoneSingaporeSomaliaSouth AfricaSouth AmericaSouth Central AsiaSouth Eastern AsiaSouthern EuropeSpainSri LankaSt. Vincent and the GrenadinesSudanSwedenSwitzerlandSyriaTaiwanThailandTrinidad and TobagoTurkeyUgandaUkraineUruguayUzbekistanVenezuelaVietnamWest IndiesWestern AfricaWestern AsiaWestern EuropeYemenZaireZimbabweAzores
Immigrants from Cameroon
Race
Ancestry
AfghanAfricanAlaska NativeAlaskan AthabascanAlbanianAleutAlsatianAmericanApacheArabArapahoArgentineanArmenianAssyrian/Chaldean/SyriacAustralianAustrianBahamianBangladeshiBarbadianBasqueBelgianBelizeanBermudanBhutaneseBlackfeetBolivianBrazilianBritishBritish West IndianBulgarianBurmeseCajunCambodianCanadianCape VerdeanCarpatho RusynCelticCentral AmericanCherokeeCheyenneChickasawChileanChineseChippewaChoctawColombianColvilleComancheCosta RicanCreeCreekCroatianCrowCubanCypriotCzechCzechoslovakianDanishDelawareDominicanDutchDutch West IndianEastern EuropeanEcuadorianEgyptianEnglishEstonianEthiopianEuropeanFijianFilipinoFinnishFrenchFrench American IndianFrench CanadianGermanGerman RussianGhanaianGreekGuamanian/ChamorroGuatemalanGuyaneseHaitianHmongHonduranHopiHoumaHungarianIcelanderIndian (Asian)IndonesianInupiatIranianIraqiIrishIroquoisIsraeliItalianJamaicanJapaneseJordanianKenyanKiowaKoreanLaotianLatvianLebaneseLiberianLithuanianLumbeeLuxembourgerMacedonianMalaysianMalteseMarshalleseMenomineeMexicanMexican American IndianMongolianMoroccanNative HawaiianNavajoNepaleseNew ZealanderNicaraguanNigerianNorthern EuropeanNorwegianOkinawanOsageOttawaPaiutePakistaniPalestinianPanamanianParaguayanPennsylvania GermanPeruvianPimaPolishPortuguesePotawatomiPuebloPuerto RicanPuget Sound SalishRomanianRussianSalvadoranSamoanScandinavianScotch-IrishScottishSeminoleSenegaleseSerbianShoshoneSierra LeoneanSiouxSlavicSlovakSloveneSomaliSouth AfricanSouth AmericanSouth American IndianSoviet UnionSpaniardSpanishSpanish AmericanSpanish American IndianSri LankanSubsaharan AfricanSudaneseSwedishSwissSyrianTaiwaneseThaiTlingit-HaidaTohono O'OdhamTonganTrinidadian and TobagonianTsimshianTurkishU.S. Virgin IslanderUgandanUkrainianUruguayanUteVenezuelanVietnameseWelshWest IndianYakamaYaquiYugoslavianYumanYup'ikZimbabwean
Immigration
NonimmigrantsImmigrantsAfghanistanAfricaAlbaniaArgentinaArmeniaAsiaAustraliaAustriaBahamasBangladeshBarbadosBelarusBelgiumBelizeBoliviaBosnia and HerzegovinaBrazilBulgariaBurma/MyanmarCabo VerdeCambodiaCameroonCanadaCaribbeanCentral AmericaChileChinaColombiaCongoCosta RicaCroatiaCubaCzechoslovakiaDenmarkDominicaDominican RepublicEastern AfricaEastern AsiaEastern EuropeEcuadorEgyptEl SalvadorEnglandEritreaEthiopiaEuropeFijiFranceGermanyGhanaGreeceGrenadaGuatemalaGuyanaHaitiHondurasHong KongHungaryIndiaIndonesiaIranIraqIrelandIsraelItalyJamaicaJapanJordanKazakhstanKenyaKoreaKuwaitLaosLatin AmericaLatviaLebanonLiberiaLithuaniaMalaysiaMexicoMicronesiaMiddle AfricaMoldovaMoroccoNepalNetherlandsNicaraguaNigeriaNorth AmericaNorth MacedoniaNorthern AfricaNorthern EuropeNorwayOceaniaPakistanPanamaPeruPhilippinesPolandPortugalRomaniaRussiaSaudi ArabiaScotlandSenegalSerbiaSierra LeoneSingaporeSomaliaSouth AfricaSouth AmericaSouth Central AsiaSouth Eastern AsiaSouthern EuropeSpainSri LankaSt. Vincent and the GrenadinesSudanSwedenSwitzerlandSyriaTaiwanThailandTrinidad and TobagoTurkeyUgandaUkraineUruguayUzbekistanVenezuelaVietnamWest IndiesWestern AfricaWestern AsiaWestern EuropeYemenZaireZimbabweAzores
Seniors Poverty Over the Age of 65
Income
Poverty
Unemployment
Labor Participation
Family Structure
Vehicle Availability
Education Level
Disability

Seniors Poverty Over the Age of 65 Comparison

Central American Indians

Immigrants from Cameroon

Tragic
Good
15.1%
SENIORS POVERTY OVER THE AGE OF 65
0.0/ 100
METRIC RATING
325th/ 347
METRIC RANK
10.6%
SENIORS POVERTY OVER THE AGE OF 65
78.1/ 100
METRIC RATING
149th/ 347
METRIC RANK

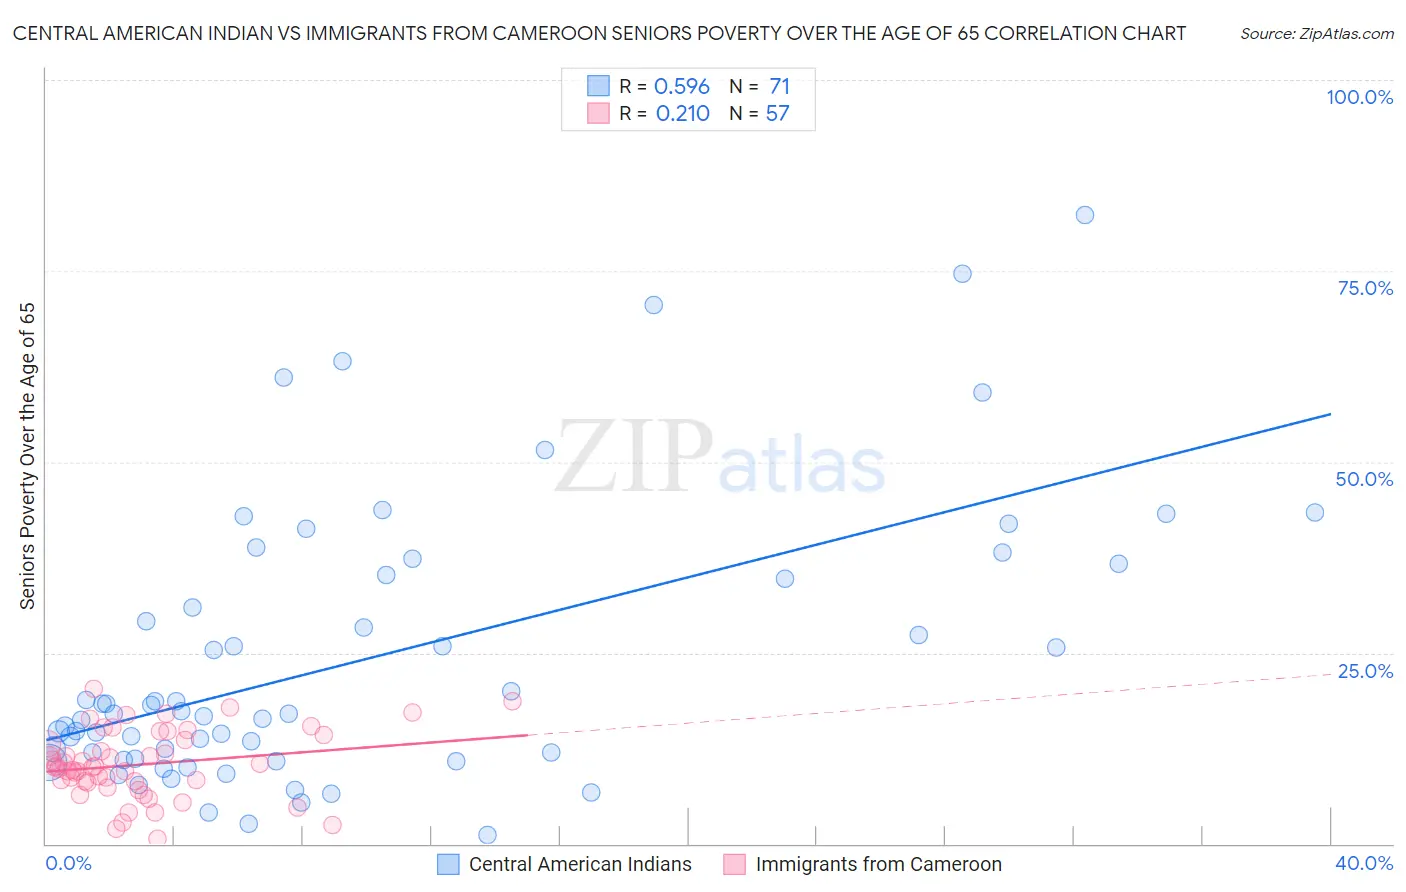
Central American Indian vs Immigrants from Cameroon Seniors Poverty Over the Age of 65 Correlation Chart

The statistical analysis conducted on geographies consisting of 325,391,809 people shows a substantial positive correlation between the proportion of Central American Indians and poverty level among seniors over the age of 65 in the United States with a correlation coefficient (R) of 0.596 and weighted average of 15.1%. Similarly, the statistical analysis conducted on geographies consisting of 130,481,344 people shows a weak positive correlation between the proportion of Immigrants from Cameroon and poverty level among seniors over the age of 65 in the United States with a correlation coefficient (R) of 0.210 and weighted average of 10.6%, a difference of 42.0%.
Central American Indian vs Immigrants from Cameroon Seniors Poverty Over the Age of 65

Seniors Poverty Over the Age of 65 Correlation Summary

MeasurementCentral American IndianImmigrants from Cameroon
Minimum1.1%0.58%
Maximum82.2%20.3%
Range81.1%19.7%
Mean24.1%10.4%
Median17.1%10.0%
Interquartile 25% (IQ1)11.2%8.1%
Interquartile 75% (IQ3)35.2%13.9%
Interquartile Range (IQR)24.1%5.9%
Standard Deviation (Sample)18.1%4.4%
Standard Deviation (Population)18.0%4.4%

Similar Demographics by Seniors Poverty Over the Age of 65

Demographics Similar to Central American Indians by Seniors Poverty Over the Age of 65

In terms of seniors poverty over the age of 65, the demographic groups most similar to Central American Indians are Nicaraguan (15.0%, a difference of 0.59%), Immigrants from Armenia (15.2%, a difference of 0.60%), Crow (15.2%, a difference of 0.86%), Sioux (15.3%, a difference of 1.4%), and Yakama (14.8%, a difference of 2.0%).
DemographicsRating | RankSeniors Poverty Over the Age of 65
Immigrants | Honduras
0.0
/100
|
#318
Tragic
14.5%
Cape Verdeans
0.0
/100
|
#319
Tragic
14.7%
Immigrants | Haiti
0.0
/100
|
#320
Tragic
14.7%
Houma
0.0
/100
|
#321
Tragic
14.7%
Immigrants | Barbados
0.0
/100
|
#322
Tragic
14.8%
Yakama
0.0
/100
|
#323
Tragic
14.8%
Nicaraguans
0.0
/100
|
#324
Tragic
15.0%
Central American Indians
0.0
/100
|
#325
Tragic
15.1%
Immigrants | Armenia
0.0
/100
|
#326
Tragic
15.2%
Crow
0.0
/100
|
#327
Tragic
15.2%
Sioux
0.0
/100
|
#328
Tragic
15.3%
Immigrants | Dominica
0.0
/100
|
#329
Tragic
15.5%
Immigrants | St. Vincent and the Grenadines
0.0
/100
|
#330
Tragic
15.5%
British West Indians
0.0
/100
|
#331
Tragic
15.6%
Immigrants | Grenada
0.0
/100
|
#332
Tragic
15.8%

Demographics Similar to Immigrants from Cameroon by Seniors Poverty Over the Age of 65

In terms of seniors poverty over the age of 65, the demographic groups most similar to Immigrants from Cameroon are American (10.6%, a difference of 0.0%), Immigrants from Switzerland (10.6%, a difference of 0.10%), Immigrants from Greece (10.6%, a difference of 0.13%), Alaskan Athabascan (10.6%, a difference of 0.15%), and Spanish (10.6%, a difference of 0.16%).
DemographicsRating | RankSeniors Poverty Over the Age of 65
Osage
82.8
/100
|
#142
Excellent
10.6%
Immigrants | Asia
80.8
/100
|
#143
Excellent
10.6%
Iraqis
80.7
/100
|
#144
Excellent
10.6%
Laotians
79.9
/100
|
#145
Good
10.6%
Alaskan Athabascans
79.1
/100
|
#146
Good
10.6%
Immigrants | Greece
79.0
/100
|
#147
Good
10.6%
Americans
78.1
/100
|
#148
Good
10.6%
Immigrants | Cameroon
78.1
/100
|
#149
Good
10.6%
Immigrants | Switzerland
77.3
/100
|
#150
Good
10.6%
Spanish
76.8
/100
|
#151
Good
10.6%
Immigrants | Egypt
76.5
/100
|
#152
Good
10.6%
Fijians
75.6
/100
|
#153
Good
10.7%
Immigrants | Saudi Arabia
74.9
/100
|
#154
Good
10.7%
Chickasaw
73.6
/100
|
#155
Good
10.7%
Ethiopians
72.9
/100
|
#156
Good
10.7%