Canadian vs Nepalese Single Father Poverty

COMPARE

Canadian
Race
Ancestry
AfghanAfricanAlaska NativeAlaskan AthabascanAlbanianAleutAlsatianAmericanApacheArabArapahoArgentineanArmenianAssyrian/Chaldean/SyriacAustralianAustrianBahamianBangladeshiBarbadianBasqueBelgianBelizeanBermudanBhutaneseBlackfeetBolivianBrazilianBritishBritish West IndianBulgarianBurmeseCajunCambodianCanadianCape VerdeanCarpatho RusynCelticCentral AmericanCentral American IndianCherokeeCheyenneChickasawChileanChineseChippewaChoctawColombianColvilleComancheCosta RicanCreeCreekCroatianCrowCubanCypriotCzechCzechoslovakianDanishDelawareDominicanDutchDutch West IndianEastern EuropeanEcuadorianEgyptianEnglishEstonianEthiopianEuropeanFijianFilipinoFinnishFrenchFrench American IndianFrench CanadianGermanGerman RussianGhanaianGreekGuamanian/ChamorroGuatemalanGuyaneseHaitianHmongHonduranHopiHoumaHungarianIcelanderIndian (Asian)IndonesianInupiatIranianIraqiIrishIroquoisIsraeliItalianJamaicanJapaneseJordanianKenyanKiowaKoreanLaotianLatvianLebaneseLiberianLithuanianLumbeeLuxembourgerMacedonianMalaysianMalteseMarshalleseMenomineeMexicanMexican American IndianMongolianMoroccanNative HawaiianNavajoNew ZealanderNicaraguanNigerianNorthern EuropeanNorwegianOkinawanOsageOttawaPaiutePakistaniPalestinianPanamanianParaguayanPennsylvania GermanPeruvianPimaPolishPortuguesePotawatomiPuebloPuerto RicanPuget Sound SalishRomanianRussianSalvadoranSamoanScandinavianScotch-IrishScottishSeminoleSenegaleseSerbianShoshoneSierra LeoneanSiouxSlavicSlovakSloveneSomaliSouth AfricanSouth AmericanSouth American IndianSoviet UnionSpaniardSpanishSpanish AmericanSpanish American IndianSri LankanSubsaharan AfricanSudaneseSwedishSwissSyrianTaiwaneseThaiTlingit-HaidaTohono O'OdhamTonganTrinidadian and TobagonianTsimshianTurkishU.S. Virgin IslanderUgandanUkrainianUruguayanUteVenezuelanVietnameseWelshWest IndianYakamaYaquiYugoslavianYumanYup'ikZimbabwean
Immigration
NonimmigrantsImmigrantsAfghanistanAfricaAlbaniaArgentinaArmeniaAsiaAustraliaAustriaBahamasBangladeshBarbadosBelarusBelgiumBelizeBoliviaBosnia and HerzegovinaBrazilBulgariaBurma/MyanmarCabo VerdeCambodiaCameroonCanadaCaribbeanCentral AmericaChileChinaColombiaCongoCosta RicaCroatiaCubaCzechoslovakiaDenmarkDominicaDominican RepublicEastern AfricaEastern AsiaEastern EuropeEcuadorEgyptEl SalvadorEnglandEritreaEthiopiaEuropeFijiFranceGermanyGhanaGreeceGrenadaGuatemalaGuyanaHaitiHondurasHong KongHungaryIndiaIndonesiaIranIraqIrelandIsraelItalyJamaicaJapanJordanKazakhstanKenyaKoreaKuwaitLaosLatin AmericaLatviaLebanonLiberiaLithuaniaMalaysiaMexicoMicronesiaMiddle AfricaMoldovaMoroccoNepalNetherlandsNicaraguaNigeriaNorth AmericaNorth MacedoniaNorthern AfricaNorthern EuropeNorwayOceaniaPakistanPanamaPeruPhilippinesPolandPortugalRomaniaRussiaSaudi ArabiaScotlandSenegalSerbiaSierra LeoneSingaporeSomaliaSouth AfricaSouth AmericaSouth Central AsiaSouth Eastern AsiaSouthern EuropeSpainSri LankaSt. Vincent and the GrenadinesSudanSwedenSwitzerlandSyriaTaiwanThailandTrinidad and TobagoTurkeyUgandaUkraineUruguayUzbekistanVenezuelaVietnamWest IndiesWestern AfricaWestern AsiaWestern EuropeYemenZaireZimbabweAzores
Nepalese
Race
Ancestry
AfghanAfricanAlaska NativeAlaskan AthabascanAlbanianAleutAlsatianAmericanApacheArabArapahoArgentineanArmenianAssyrian/Chaldean/SyriacAustralianAustrianBahamianBangladeshiBarbadianBasqueBelgianBelizeanBermudanBhutaneseBlackfeetBolivianBrazilianBritishBritish West IndianBulgarianBurmeseCajunCambodianCape VerdeanCarpatho RusynCelticCentral AmericanCentral American IndianCherokeeCheyenneChickasawChileanChineseChippewaChoctawColombianColvilleComancheCosta RicanCreeCreekCroatianCrowCubanCypriotCzechCzechoslovakianDanishDelawareDominicanDutchDutch West IndianEastern EuropeanEcuadorianEgyptianEnglishEstonianEthiopianEuropeanFijianFilipinoFinnishFrenchFrench American IndianFrench CanadianGermanGerman RussianGhanaianGreekGuamanian/ChamorroGuatemalanGuyaneseHaitianHmongHonduranHopiHoumaHungarianIcelanderIndian (Asian)IndonesianInupiatIranianIraqiIrishIroquoisIsraeliItalianJamaicanJapaneseJordanianKenyanKiowaKoreanLaotianLatvianLebaneseLiberianLithuanianLumbeeLuxembourgerMacedonianMalaysianMalteseMarshalleseMenomineeMexicanMexican American IndianMongolianMoroccanNative HawaiianNavajoNepaleseNew ZealanderNicaraguanNigerianNorthern EuropeanNorwegianOkinawanOsageOttawaPaiutePakistaniPalestinianPanamanianParaguayanPennsylvania GermanPeruvianPimaPolishPortuguesePotawatomiPuebloPuerto RicanPuget Sound SalishRomanianRussianSalvadoranSamoanScandinavianScotch-IrishScottishSeminoleSenegaleseSerbianShoshoneSierra LeoneanSiouxSlavicSlovakSloveneSomaliSouth AfricanSouth AmericanSouth American IndianSoviet UnionSpaniardSpanishSpanish AmericanSpanish American IndianSri LankanSubsaharan AfricanSudaneseSwedishSwissSyrianTaiwaneseThaiTlingit-HaidaTohono O'OdhamTonganTrinidadian and TobagonianTsimshianTurkishU.S. Virgin IslanderUgandanUkrainianUruguayanUteVenezuelanVietnameseWelshWest IndianYakamaYaquiYugoslavianYumanYup'ikZimbabwean
Immigration
NonimmigrantsImmigrantsAfghanistanAfricaAlbaniaArgentinaArmeniaAsiaAustraliaAustriaBahamasBangladeshBarbadosBelarusBelgiumBelizeBoliviaBosnia and HerzegovinaBrazilBulgariaBurma/MyanmarCabo VerdeCambodiaCameroonCanadaCaribbeanCentral AmericaChileChinaColombiaCongoCosta RicaCroatiaCubaCzechoslovakiaDenmarkDominicaDominican RepublicEastern AfricaEastern AsiaEastern EuropeEcuadorEgyptEl SalvadorEnglandEritreaEthiopiaEuropeFijiFranceGermanyGhanaGreeceGrenadaGuatemalaGuyanaHaitiHondurasHong KongHungaryIndiaIndonesiaIranIraqIrelandIsraelItalyJamaicaJapanJordanKazakhstanKenyaKoreaKuwaitLaosLatin AmericaLatviaLebanonLiberiaLithuaniaMalaysiaMexicoMicronesiaMiddle AfricaMoldovaMoroccoNepalNetherlandsNicaraguaNigeriaNorth AmericaNorth MacedoniaNorthern AfricaNorthern EuropeNorwayOceaniaPakistanPanamaPeruPhilippinesPolandPortugalRomaniaRussiaSaudi ArabiaScotlandSenegalSerbiaSierra LeoneSingaporeSomaliaSouth AfricaSouth AmericaSouth Central AsiaSouth Eastern AsiaSouthern EuropeSpainSri LankaSt. Vincent and the GrenadinesSudanSwedenSwitzerlandSyriaTaiwanThailandTrinidad and TobagoTurkeyUgandaUkraineUruguayUzbekistanVenezuelaVietnamWest IndiesWestern AfricaWestern AsiaWestern EuropeYemenZaireZimbabweAzores
Single Father Poverty
Income
Poverty
Unemployment
Labor Participation
Family Structure
Vehicle Availability
Education Level
Disability

Single Father Poverty Comparison

Canadians

Nepalese

Tragic
Exceptional
17.1%
SINGLE FATHER POVERTY
1.3/ 100
METRIC RATING
249th/ 347
METRIC RANK
14.4%
SINGLE FATHER POVERTY
100.0/ 100
METRIC RATING
27th/ 347
METRIC RANK

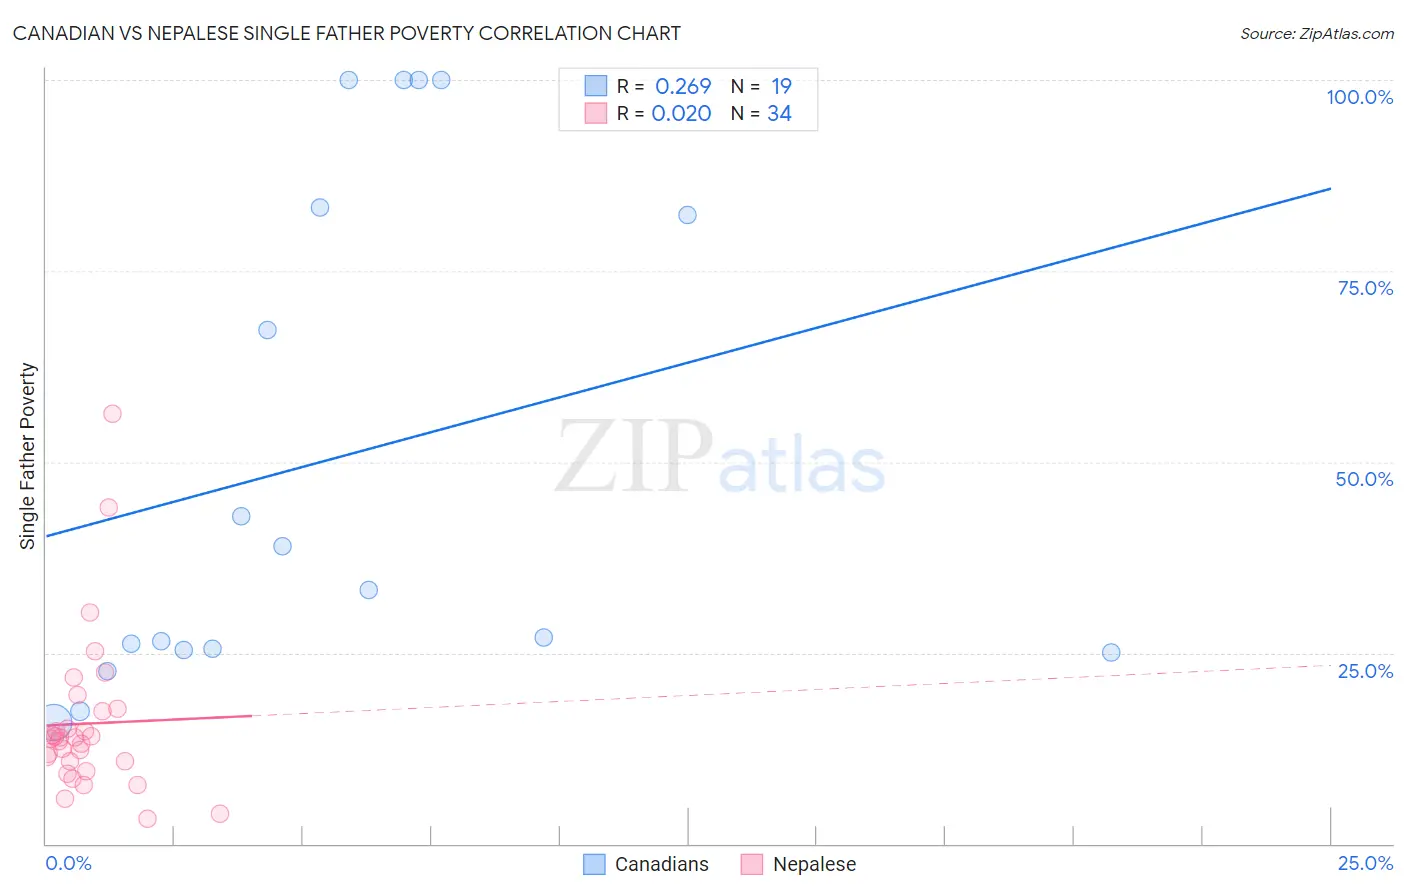
Canadian vs Nepalese Single Father Poverty Correlation Chart

The statistical analysis conducted on geographies consisting of 333,608,234 people shows a weak positive correlation between the proportion of Canadians and poverty level among single fathers in the United States with a correlation coefficient (R) of 0.269 and weighted average of 17.1%. Similarly, the statistical analysis conducted on geographies consisting of 23,366,556 people shows no correlation between the proportion of Nepalese and poverty level among single fathers in the United States with a correlation coefficient (R) of 0.020 and weighted average of 14.4%, a difference of 18.4%.
Canadian vs Nepalese Single Father Poverty

Single Father Poverty Correlation Summary

MeasurementCanadianNepalese
Minimum15.9%3.3%
Maximum100.0%56.2%
Range84.1%52.9%
Mean50.5%15.7%
Median33.2%13.8%
Interquartile 25% (IQ1)25.4%10.8%
Interquartile 75% (IQ3)83.3%17.3%
Interquartile Range (IQR)57.9%6.5%
Standard Deviation (Sample)32.8%10.5%
Standard Deviation (Population)31.9%10.3%

Similar Demographics by Single Father Poverty

Demographics Similar to Canadians by Single Father Poverty

In terms of single father poverty, the demographic groups most similar to Canadians are Czechoslovakian (17.1%, a difference of 0.040%), Greek (17.1%, a difference of 0.050%), Austrian (17.1%, a difference of 0.13%), Luxembourger (17.1%, a difference of 0.14%), and Immigrants from Ireland (17.1%, a difference of 0.15%).
DemographicsRating | RankSingle Father Poverty
Moroccans
2.1
/100
|
#242
Tragic
17.0%
Immigrants | Cabo Verde
1.6
/100
|
#243
Tragic
17.0%
Hondurans
1.6
/100
|
#244
Tragic
17.0%
Trinidadians and Tobagonians
1.5
/100
|
#245
Tragic
17.0%
Immigrants | Ireland
1.4
/100
|
#246
Tragic
17.1%
Greeks
1.3
/100
|
#247
Tragic
17.1%
Czechoslovakians
1.3
/100
|
#248
Tragic
17.1%
Canadians
1.3
/100
|
#249
Tragic
17.1%
Austrians
1.1
/100
|
#250
Tragic
17.1%
Luxembourgers
1.1
/100
|
#251
Tragic
17.1%
Croatians
1.0
/100
|
#252
Tragic
17.1%
Cree
1.0
/100
|
#253
Tragic
17.1%
Immigrants | Honduras
0.9
/100
|
#254
Tragic
17.1%
Sierra Leoneans
0.8
/100
|
#255
Tragic
17.2%
Immigrants | Haiti
0.8
/100
|
#256
Tragic
17.2%

Demographics Similar to Nepalese by Single Father Poverty

In terms of single father poverty, the demographic groups most similar to Nepalese are Spanish American Indian (14.4%, a difference of 0.050%), Iranian (14.4%, a difference of 0.48%), Immigrants from South Eastern Asia (14.4%, a difference of 0.51%), Immigrants from Egypt (14.4%, a difference of 0.52%), and Immigrants from South Central Asia (14.5%, a difference of 0.53%).
DemographicsRating | RankSingle Father Poverty
Immigrants | Singapore
100.0
/100
|
#20
Exceptional
14.3%
Immigrants | Afghanistan
100.0
/100
|
#21
Exceptional
14.3%
Taiwanese
100.0
/100
|
#22
Exceptional
14.3%
Immigrants | Egypt
100.0
/100
|
#23
Exceptional
14.4%
Immigrants | South Eastern Asia
100.0
/100
|
#24
Exceptional
14.4%
Iranians
100.0
/100
|
#25
Exceptional
14.4%
Spanish American Indians
100.0
/100
|
#26
Exceptional
14.4%
Nepalese
100.0
/100
|
#27
Exceptional
14.4%
Immigrants | South Central Asia
100.0
/100
|
#28
Exceptional
14.5%
Somalis
100.0
/100
|
#29
Exceptional
14.5%
Thais
100.0
/100
|
#30
Exceptional
14.5%
Icelanders
100.0
/100
|
#31
Exceptional
14.5%
Asians
100.0
/100
|
#32
Exceptional
14.6%
Okinawans
100.0
/100
|
#33
Exceptional
14.6%
Egyptians
100.0
/100
|
#34
Exceptional
14.7%