Burmese vs Immigrants from Egypt Female Poverty Among 25-34 Year Olds
COMPARE
Burmese
Immigrants from Egypt
Female Poverty Among 25-34 Year Olds
Female Poverty Among 25-34 Year Olds Comparison
Burmese
Immigrants from Egypt
11.2%
FEMALE POVERTY AMONG 25-34 YEAR OLDS
100.0/ 100
METRIC RATING
13th/ 347
METRIC RANK
12.0%
FEMALE POVERTY AMONG 25-34 YEAR OLDS
99.6/ 100
METRIC RATING
49th/ 347
METRIC RANK
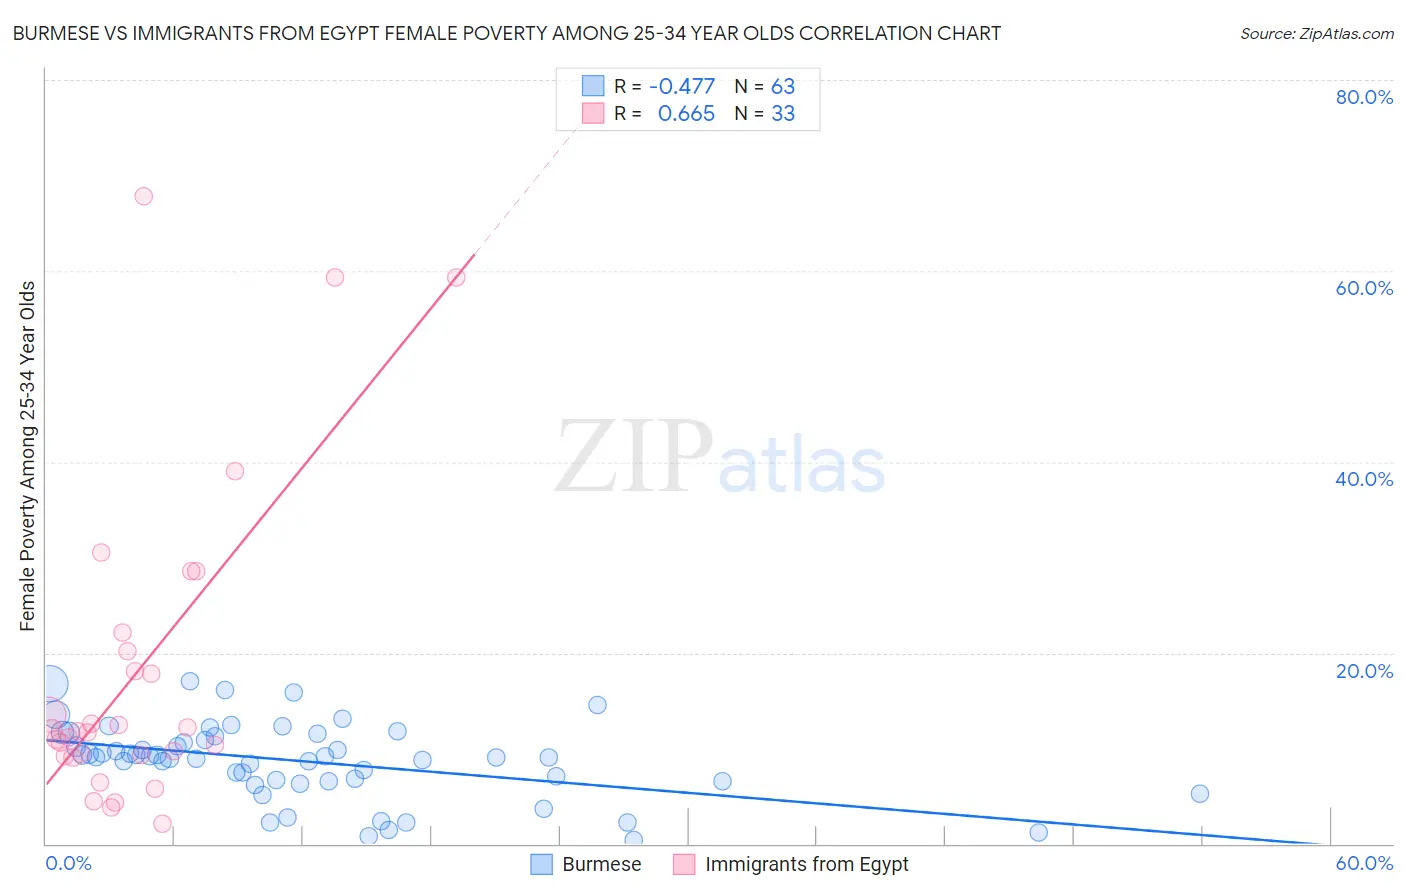
Burmese vs Immigrants from Egypt Female Poverty Among 25-34 Year Olds Correlation Chart
The statistical analysis conducted on geographies consisting of 455,200,950 people shows a moderate negative correlation between the proportion of Burmese and poverty level among females between the ages 25 and 34 in the United States with a correlation coefficient (R) of -0.477 and weighted average of 11.2%. Similarly, the statistical analysis conducted on geographies consisting of 242,883,921 people shows a significant positive correlation between the proportion of Immigrants from Egypt and poverty level among females between the ages 25 and 34 in the United States with a correlation coefficient (R) of 0.665 and weighted average of 12.0%, a difference of 7.2%.
Female Poverty Among 25-34 Year Olds Correlation Summary
| Measurement | Burmese | Immigrants from Egypt |
| Minimum | 0.35% | 2.0% |
| Maximum | 17.0% | 67.8% |
| Range | 16.7% | 65.8% |
| Mean | 8.7% | 18.0% |
| Median | 9.1% | 11.8% |
| Interquartile 25% (IQ1) | 6.6% | 9.2% |
| Interquartile 75% (IQ3) | 11.3% | 21.2% |
| Interquartile Range (IQR) | 4.7% | 11.9% |
| Standard Deviation (Sample) | 3.9% | 16.5% |
| Standard Deviation (Population) | 3.9% | 16.2% |
Similar Demographics by Female Poverty Among 25-34 Year Olds
Demographics Similar to Burmese by Female Poverty Among 25-34 Year Olds
In terms of female poverty among 25-34 year olds, the demographic groups most similar to Burmese are Indian (Asian) (11.2%, a difference of 0.010%), Immigrants from Ireland (11.2%, a difference of 0.11%), Assyrian/Chaldean/Syriac (11.2%, a difference of 0.11%), Immigrants from Bolivia (11.2%, a difference of 0.15%), and Immigrants from China (11.2%, a difference of 0.22%).
| Demographics | Rating | Rank | Female Poverty Among 25-34 Year Olds |
| Immigrants | South Central Asia | 100.0 /100 | #6 | Exceptional 10.8% |
| Chinese | 100.0 /100 | #7 | Exceptional 11.0% |
| Immigrants | Iran | 100.0 /100 | #8 | Exceptional 11.0% |
| Immigrants | Singapore | 100.0 /100 | #9 | Exceptional 11.1% |
| Immigrants | Lithuania | 100.0 /100 | #10 | Exceptional 11.1% |
| Immigrants | Korea | 100.0 /100 | #11 | Exceptional 11.1% |
| Immigrants | Ireland | 100.0 /100 | #12 | Exceptional 11.2% |
| Burmese | 100.0 /100 | #13 | Exceptional 11.2% |
| Indians (Asian) | 100.0 /100 | #14 | Exceptional 11.2% |
| Assyrians/Chaldeans/Syriacs | 100.0 /100 | #15 | Exceptional 11.2% |
| Immigrants | Bolivia | 100.0 /100 | #16 | Exceptional 11.2% |
| Immigrants | China | 100.0 /100 | #17 | Exceptional 11.2% |
| Immigrants | Eastern Asia | 100.0 /100 | #18 | Exceptional 11.2% |
| Iranians | 100.0 /100 | #19 | Exceptional 11.2% |
| Okinawans | 100.0 /100 | #20 | Exceptional 11.3% |
Demographics Similar to Immigrants from Egypt by Female Poverty Among 25-34 Year Olds
In terms of female poverty among 25-34 year olds, the demographic groups most similar to Immigrants from Egypt are Immigrants from Croatia (12.0%, a difference of 0.020%), Paraguayan (12.0%, a difference of 0.020%), Immigrants from Eastern Europe (12.0%, a difference of 0.040%), Immigrants from Belarus (12.0%, a difference of 0.080%), and Korean (12.0%, a difference of 0.13%).
| Demographics | Rating | Rank | Female Poverty Among 25-34 Year Olds |
| Immigrants | Turkey | 99.7 /100 | #42 | Exceptional 11.9% |
| Egyptians | 99.7 /100 | #43 | Exceptional 11.9% |
| Immigrants | Australia | 99.7 /100 | #44 | Exceptional 11.9% |
| Macedonians | 99.7 /100 | #45 | Exceptional 11.9% |
| Immigrants | Serbia | 99.7 /100 | #46 | Exceptional 11.9% |
| Koreans | 99.6 /100 | #47 | Exceptional 12.0% |
| Immigrants | Belarus | 99.6 /100 | #48 | Exceptional 12.0% |
| Immigrants | Egypt | 99.6 /100 | #49 | Exceptional 12.0% |
| Immigrants | Croatia | 99.6 /100 | #50 | Exceptional 12.0% |
| Paraguayans | 99.6 /100 | #51 | Exceptional 12.0% |
| Immigrants | Eastern Europe | 99.6 /100 | #52 | Exceptional 12.0% |
| Immigrants | Israel | 99.6 /100 | #53 | Exceptional 12.0% |
| Eastern Europeans | 99.6 /100 | #54 | Exceptional 12.0% |
| Immigrants | Philippines | 99.5 /100 | #55 | Exceptional 12.0% |
| Luxembourgers | 99.5 /100 | #56 | Exceptional 12.1% |