British West Indian vs Immigrants from Somalia Male Poverty
COMPARE
British West Indian
Immigrants from Somalia
Male Poverty
Male Poverty Comparison
British West Indians
Immigrants from Somalia
14.6%
MALE POVERTY
0.0/ 100
METRIC RATING
316th/ 347
METRIC RANK
14.6%
MALE POVERTY
0.0/ 100
METRIC RATING
313th/ 347
METRIC RANK
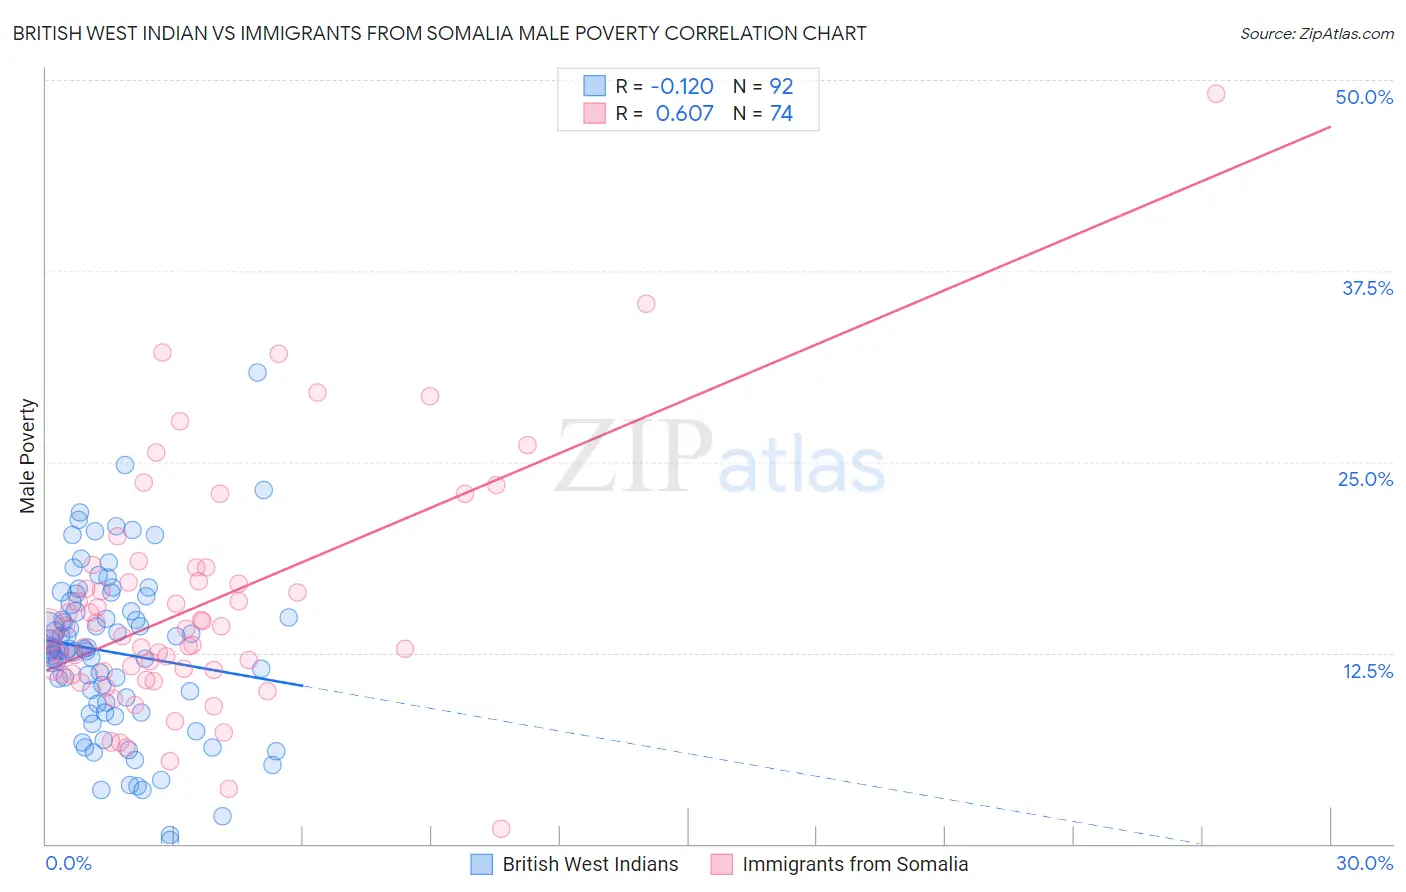
British West Indian vs Immigrants from Somalia Male Poverty Correlation Chart
The statistical analysis conducted on geographies consisting of 152,618,428 people shows a poor negative correlation between the proportion of British West Indians and poverty level among males in the United States with a correlation coefficient (R) of -0.120 and weighted average of 14.6%. Similarly, the statistical analysis conducted on geographies consisting of 92,092,836 people shows a significant positive correlation between the proportion of Immigrants from Somalia and poverty level among males in the United States with a correlation coefficient (R) of 0.607 and weighted average of 14.6%, a difference of 0.14%.
Male Poverty Correlation Summary
| Measurement | British West Indian | Immigrants from Somalia |
| Minimum | 0.21% | 1.0% |
| Maximum | 30.9% | 49.1% |
| Range | 30.7% | 48.1% |
| Mean | 12.5% | 15.5% |
| Median | 12.7% | 13.8% |
| Interquartile 25% (IQ1) | 8.9% | 11.3% |
| Interquartile 75% (IQ3) | 15.5% | 17.2% |
| Interquartile Range (IQR) | 6.6% | 5.9% |
| Standard Deviation (Sample) | 5.5% | 7.8% |
| Standard Deviation (Population) | 5.5% | 7.7% |
Demographics Similar to British West Indians and Immigrants from Somalia by Male Poverty
In terms of male poverty, the demographic groups most similar to British West Indians are Chippewa (14.6%, a difference of 0.020%), Immigrants from Honduras (14.6%, a difference of 0.10%), Immigrants from Dominica (14.7%, a difference of 0.68%), Immigrants from Grenada (14.7%, a difference of 0.74%), and U.S. Virgin Islander (14.7%, a difference of 0.76%). Similarly, the demographic groups most similar to Immigrants from Somalia are Immigrants from Honduras (14.6%, a difference of 0.040%), Chippewa (14.6%, a difference of 0.11%), Immigrants from Dominica (14.7%, a difference of 0.82%), Immigrants from Grenada (14.7%, a difference of 0.87%), and U.S. Virgin Islander (14.7%, a difference of 0.90%).
| Demographics | Rating | Rank | Male Poverty |
| Senegalese | 0.0 /100 | #304 | Tragic 14.1% |
| Immigrants | Bangladesh | 0.0 /100 | #305 | Tragic 14.1% |
| Creek | 0.0 /100 | #306 | Tragic 14.1% |
| Dutch West Indians | 0.0 /100 | #307 | Tragic 14.2% |
| Africans | 0.0 /100 | #308 | Tragic 14.2% |
| Somalis | 0.0 /100 | #309 | Tragic 14.3% |
| Seminole | 0.0 /100 | #310 | Tragic 14.3% |
| Hondurans | 0.0 /100 | #311 | Tragic 14.3% |
| Choctaw | 0.0 /100 | #312 | Tragic 14.4% |
| Immigrants | Somalia | 0.0 /100 | #313 | Tragic 14.6% |
| Immigrants | Honduras | 0.0 /100 | #314 | Tragic 14.6% |
| Chippewa | 0.0 /100 | #315 | Tragic 14.6% |
| British West Indians | 0.0 /100 | #316 | Tragic 14.6% |
| Immigrants | Dominica | 0.0 /100 | #317 | Tragic 14.7% |
| Immigrants | Grenada | 0.0 /100 | #318 | Tragic 14.7% |
| U.S. Virgin Islanders | 0.0 /100 | #319 | Tragic 14.7% |
| Immigrants | Congo | 0.0 /100 | #320 | Tragic 14.7% |
| Arapaho | 0.0 /100 | #321 | Tragic 15.1% |
| Kiowa | 0.0 /100 | #322 | Tragic 15.2% |
| Colville | 0.0 /100 | #323 | Tragic 15.2% |
| Menominee | 0.0 /100 | #324 | Tragic 15.3% |