British vs Hawaiian Single Male Poverty
COMPARE
British
Hawaiian
Single Male Poverty
Single Male Poverty Comparison
British
Hawaiians
13.3%
SINGLE MALE POVERTY
4.0/ 100
METRIC RATING
233rd/ 347
METRIC RANK
12.6%
SINGLE MALE POVERTY
75.1/ 100
METRIC RATING
144th/ 347
METRIC RANK
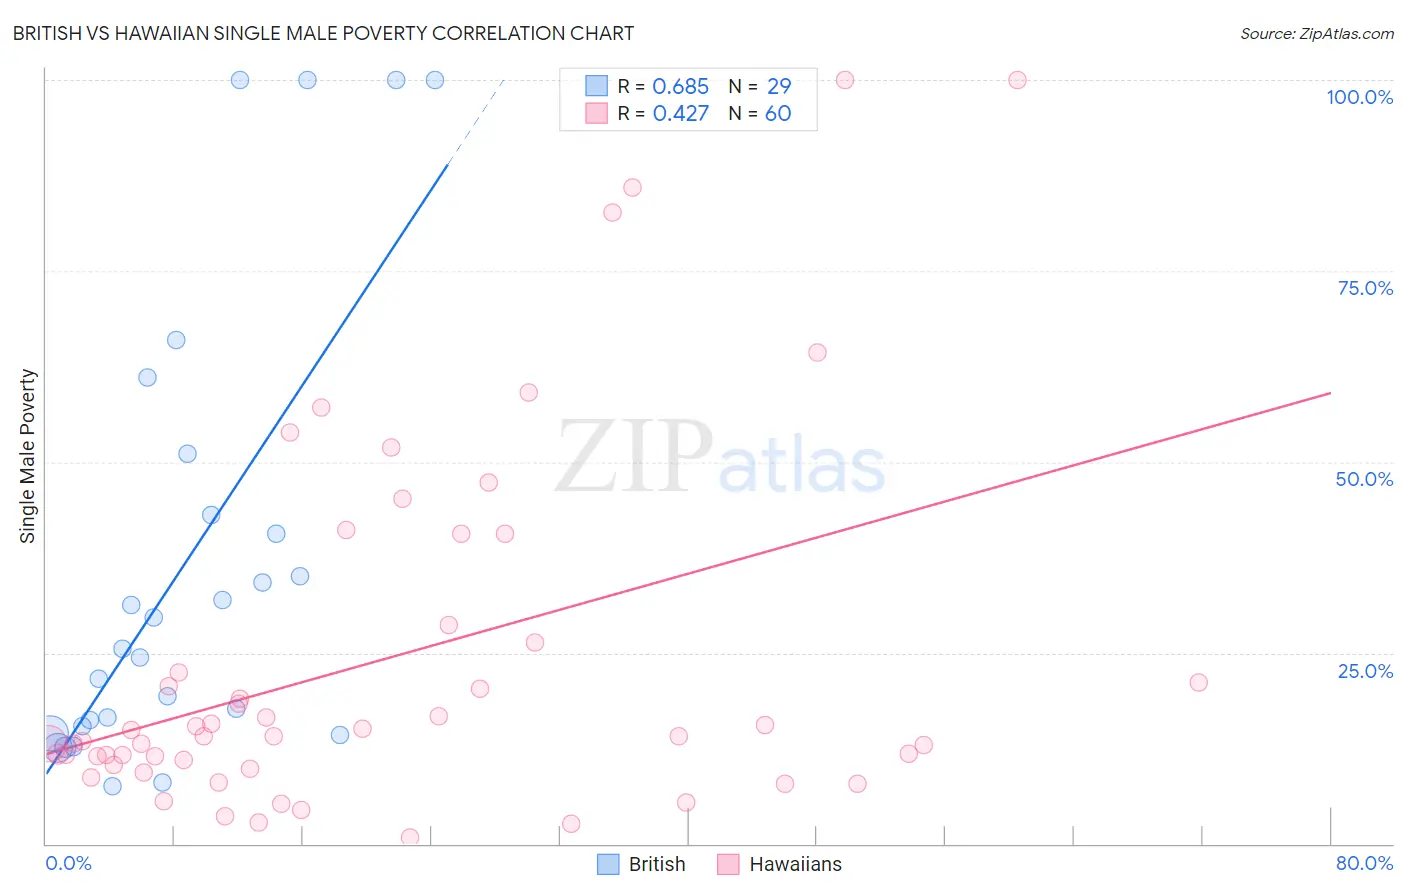
British vs Hawaiian Single Male Poverty Correlation Chart
The statistical analysis conducted on geographies consisting of 447,626,484 people shows a significant positive correlation between the proportion of British and poverty level among single males in the United States with a correlation coefficient (R) of 0.685 and weighted average of 13.3%. Similarly, the statistical analysis conducted on geographies consisting of 300,272,441 people shows a moderate positive correlation between the proportion of Hawaiians and poverty level among single males in the United States with a correlation coefficient (R) of 0.427 and weighted average of 12.6%, a difference of 5.7%.
Single Male Poverty Correlation Summary
| Measurement | British | Hawaiian |
| Minimum | 7.6% | 0.75% |
| Maximum | 100.0% | 100.0% |
| Range | 92.4% | 99.3% |
| Mean | 36.6% | 24.1% |
| Median | 25.5% | 14.1% |
| Interquartile 25% (IQ1) | 14.9% | 10.7% |
| Interquartile 75% (IQ3) | 47.1% | 27.4% |
| Interquartile Range (IQR) | 32.2% | 16.7% |
| Standard Deviation (Sample) | 29.7% | 24.0% |
| Standard Deviation (Population) | 29.2% | 23.8% |
Similar Demographics by Single Male Poverty
Demographics Similar to British by Single Male Poverty
In terms of single male poverty, the demographic groups most similar to British are Canadian (13.3%, a difference of 0.0%), Bangladeshi (13.3%, a difference of 0.10%), Luxembourger (13.4%, a difference of 0.16%), British West Indian (13.4%, a difference of 0.21%), and Immigrants from Caribbean (13.3%, a difference of 0.29%).
| Demographics | Rating | Rank | Single Male Poverty |
| Jamaicans | 7.7 /100 | #226 | Tragic 13.2% |
| Haitians | 7.0 /100 | #227 | Tragic 13.2% |
| Lebanese | 6.6 /100 | #228 | Tragic 13.2% |
| Europeans | 6.2 /100 | #229 | Tragic 13.3% |
| Ghanaians | 6.1 /100 | #230 | Tragic 13.3% |
| Slavs | 5.3 /100 | #231 | Tragic 13.3% |
| Immigrants | Caribbean | 5.0 /100 | #232 | Tragic 13.3% |
| British | 4.0 /100 | #233 | Tragic 13.3% |
| Canadians | 4.0 /100 | #234 | Tragic 13.3% |
| Bangladeshis | 3.7 /100 | #235 | Tragic 13.3% |
| Luxembourgers | 3.6 /100 | #236 | Tragic 13.4% |
| British West Indians | 3.4 /100 | #237 | Tragic 13.4% |
| Immigrants | Ghana | 3.2 /100 | #238 | Tragic 13.4% |
| Czechoslovakians | 3.0 /100 | #239 | Tragic 13.4% |
| Belizeans | 2.3 /100 | #240 | Tragic 13.4% |
Demographics Similar to Hawaiians by Single Male Poverty
In terms of single male poverty, the demographic groups most similar to Hawaiians are Immigrants from Lebanon (12.6%, a difference of 0.010%), Native Hawaiian (12.6%, a difference of 0.010%), Malaysian (12.6%, a difference of 0.020%), Immigrants from France (12.6%, a difference of 0.050%), and Okinawan (12.6%, a difference of 0.060%).
| Demographics | Rating | Rank | Single Male Poverty |
| Ukrainians | 80.7 /100 | #137 | Excellent 12.6% |
| Immigrants | El Salvador | 80.0 /100 | #138 | Excellent 12.6% |
| Cubans | 79.9 /100 | #139 | Good 12.6% |
| Immigrants | Zimbabwe | 78.0 /100 | #140 | Good 12.6% |
| Okinawans | 75.9 /100 | #141 | Good 12.6% |
| Immigrants | Uganda | 75.9 /100 | #142 | Good 12.6% |
| Immigrants | France | 75.8 /100 | #143 | Good 12.6% |
| Hawaiians | 75.1 /100 | #144 | Good 12.6% |
| Immigrants | Lebanon | 75.0 /100 | #145 | Good 12.6% |
| Native Hawaiians | 75.0 /100 | #146 | Good 12.6% |
| Malaysians | 74.8 /100 | #147 | Good 12.6% |
| Yugoslavians | 73.9 /100 | #148 | Good 12.6% |
| Sierra Leoneans | 73.0 /100 | #149 | Good 12.6% |
| Immigrants | Panama | 72.1 /100 | #150 | Good 12.6% |
| Immigrants | Hungary | 71.9 /100 | #151 | Good 12.6% |