Brazilian vs Slavic Single Mother Poverty
COMPARE
Brazilian
Slavic
Single Mother Poverty
Single Mother Poverty Comparison
Brazilians
Slavs
28.3%
SINGLE MOTHER POVERTY
92.4/ 100
METRIC RATING
118th/ 347
METRIC RANK
29.6%
SINGLE MOTHER POVERTY
24.5/ 100
METRIC RATING
195th/ 347
METRIC RANK
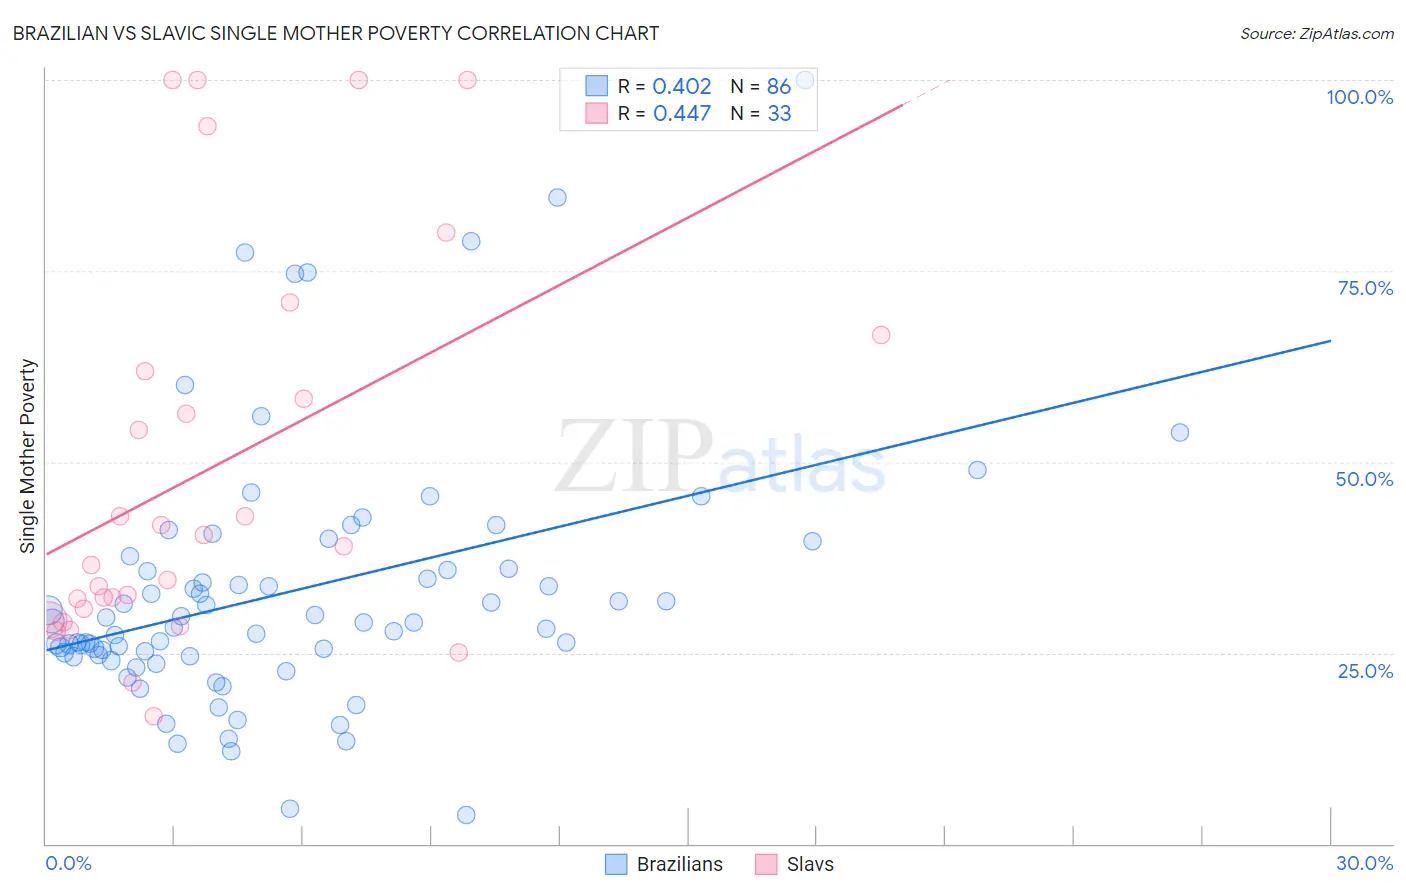
Brazilian vs Slavic Single Mother Poverty Correlation Chart
The statistical analysis conducted on geographies consisting of 317,046,418 people shows a moderate positive correlation between the proportion of Brazilians and poverty level among single mothers in the United States with a correlation coefficient (R) of 0.402 and weighted average of 28.3%. Similarly, the statistical analysis conducted on geographies consisting of 265,304,000 people shows a moderate positive correlation between the proportion of Slavs and poverty level among single mothers in the United States with a correlation coefficient (R) of 0.447 and weighted average of 29.6%, a difference of 4.5%.
Single Mother Poverty Correlation Summary
| Measurement | Brazilian | Slavic |
| Minimum | 3.8% | 16.7% |
| Maximum | 100.0% | 100.0% |
| Range | 96.2% | 83.3% |
| Mean | 33.0% | 49.1% |
| Median | 29.0% | 38.9% |
| Interquartile 25% (IQ1) | 24.7% | 30.0% |
| Interquartile 75% (IQ3) | 36.1% | 64.3% |
| Interquartile Range (IQR) | 11.4% | 34.3% |
| Standard Deviation (Sample) | 16.9% | 25.8% |
| Standard Deviation (Population) | 16.8% | 25.4% |
Similar Demographics by Single Mother Poverty
Demographics Similar to Brazilians by Single Mother Poverty
In terms of single mother poverty, the demographic groups most similar to Brazilians are Australian (28.3%, a difference of 0.010%), Immigrants from Syria (28.3%, a difference of 0.010%), Immigrants from Uganda (28.3%, a difference of 0.020%), Cypriot (28.3%, a difference of 0.030%), and Immigrants from Kuwait (28.3%, a difference of 0.040%).
| Demographics | Rating | Rank | Single Mother Poverty |
| Venezuelans | 94.5 /100 | #111 | Exceptional 28.2% |
| Immigrants | Kazakhstan | 94.5 /100 | #112 | Exceptional 28.2% |
| Immigrants | South Africa | 93.2 /100 | #113 | Exceptional 28.3% |
| Immigrants | Western Asia | 92.7 /100 | #114 | Exceptional 28.3% |
| Immigrants | Kuwait | 92.7 /100 | #115 | Exceptional 28.3% |
| Immigrants | Uganda | 92.5 /100 | #116 | Exceptional 28.3% |
| Australians | 92.5 /100 | #117 | Exceptional 28.3% |
| Brazilians | 92.4 /100 | #118 | Exceptional 28.3% |
| Immigrants | Syria | 92.4 /100 | #119 | Exceptional 28.3% |
| Cypriots | 92.3 /100 | #120 | Exceptional 28.3% |
| Immigrants | Afghanistan | 92.1 /100 | #121 | Exceptional 28.3% |
| Colombians | 91.8 /100 | #122 | Exceptional 28.3% |
| Uruguayans | 91.7 /100 | #123 | Exceptional 28.3% |
| Immigrants | Switzerland | 91.7 /100 | #124 | Exceptional 28.3% |
| Kenyans | 90.9 /100 | #125 | Exceptional 28.4% |
Demographics Similar to Slavs by Single Mother Poverty
In terms of single mother poverty, the demographic groups most similar to Slavs are Spanish American Indian (29.6%, a difference of 0.070%), Icelander (29.5%, a difference of 0.10%), Immigrants from Jamaica (29.6%, a difference of 0.17%), Trinidadian and Tobagonian (29.6%, a difference of 0.18%), and Basque (29.5%, a difference of 0.23%).
| Demographics | Rating | Rank | Single Mother Poverty |
| Guamanians/Chamorros | 31.8 /100 | #188 | Fair 29.4% |
| Immigrants | Africa | 31.6 /100 | #189 | Fair 29.4% |
| Immigrants | Germany | 30.4 /100 | #190 | Fair 29.5% |
| Immigrants | Trinidad and Tobago | 29.2 /100 | #191 | Fair 29.5% |
| Moroccans | 28.6 /100 | #192 | Fair 29.5% |
| Basques | 28.3 /100 | #193 | Fair 29.5% |
| Icelanders | 26.1 /100 | #194 | Fair 29.5% |
| Slavs | 24.5 /100 | #195 | Fair 29.6% |
| Spanish American Indians | 23.4 /100 | #196 | Fair 29.6% |
| Immigrants | Jamaica | 22.0 /100 | #197 | Fair 29.6% |
| Trinidadians and Tobagonians | 21.7 /100 | #198 | Fair 29.6% |
| Cubans | 20.8 /100 | #199 | Fair 29.6% |
| Panamanians | 20.0 /100 | #200 | Fair 29.6% |
| Belgians | 18.8 /100 | #201 | Poor 29.7% |
| Malaysians | 17.4 /100 | #202 | Poor 29.7% |