Brazilian vs Immigrants from Sierra Leone Female Poverty Among 25-34 Year Olds
COMPARE
Brazilian
Immigrants from Sierra Leone
Female Poverty Among 25-34 Year Olds
Female Poverty Among 25-34 Year Olds Comparison
Brazilians
Immigrants from Sierra Leone
13.1%
FEMALE POVERTY AMONG 25-34 YEAR OLDS
84.5/ 100
METRIC RATING
138th/ 347
METRIC RANK
13.3%
FEMALE POVERTY AMONG 25-34 YEAR OLDS
72.9/ 100
METRIC RATING
155th/ 347
METRIC RANK
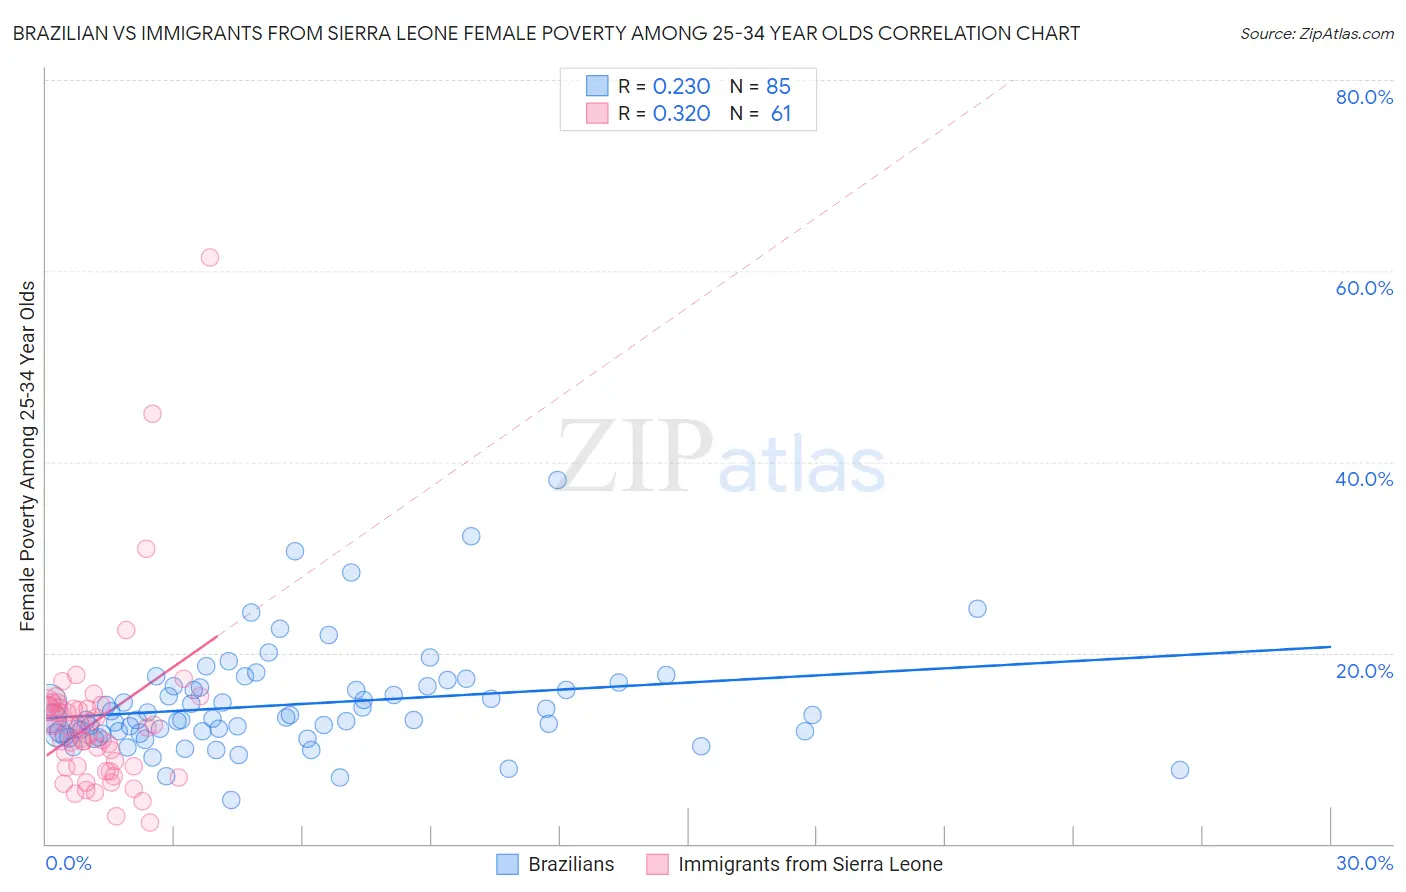
Brazilian vs Immigrants from Sierra Leone Female Poverty Among 25-34 Year Olds Correlation Chart
The statistical analysis conducted on geographies consisting of 319,734,086 people shows a weak positive correlation between the proportion of Brazilians and poverty level among females between the ages 25 and 34 in the United States with a correlation coefficient (R) of 0.230 and weighted average of 13.1%. Similarly, the statistical analysis conducted on geographies consisting of 101,180,694 people shows a mild positive correlation between the proportion of Immigrants from Sierra Leone and poverty level among females between the ages 25 and 34 in the United States with a correlation coefficient (R) of 0.320 and weighted average of 13.3%, a difference of 1.5%.
Female Poverty Among 25-34 Year Olds Correlation Summary
| Measurement | Brazilian | Immigrants from Sierra Leone |
| Minimum | 4.6% | 2.2% |
| Maximum | 38.1% | 61.4% |
| Range | 33.5% | 59.2% |
| Mean | 14.6% | 12.9% |
| Median | 13.0% | 12.4% |
| Interquartile 25% (IQ1) | 11.6% | 8.1% |
| Interquartile 75% (IQ3) | 16.4% | 14.4% |
| Interquartile Range (IQR) | 4.8% | 6.4% |
| Standard Deviation (Sample) | 5.5% | 9.0% |
| Standard Deviation (Population) | 5.4% | 8.9% |
Demographics Similar to Brazilians and Immigrants from Sierra Leone by Female Poverty Among 25-34 Year Olds
In terms of female poverty among 25-34 year olds, the demographic groups most similar to Brazilians are Immigrants from Chile (13.1%, a difference of 0.010%), Austrian (13.1%, a difference of 0.13%), Immigrants from Iraq (13.1%, a difference of 0.15%), Immigrants from England (13.0%, a difference of 0.17%), and New Zealander (13.1%, a difference of 0.18%). Similarly, the demographic groups most similar to Immigrants from Sierra Leone are Arab (13.2%, a difference of 0.070%), Northern European (13.2%, a difference of 0.090%), Immigrants from Cameroon (13.3%, a difference of 0.090%), Slavic (13.2%, a difference of 0.32%), and Costa Rican (13.2%, a difference of 0.33%).
| Demographics | Rating | Rank | Female Poverty Among 25-34 Year Olds |
| Immigrants | England | 85.5 /100 | #136 | Excellent 13.0% |
| Immigrants | Chile | 84.6 /100 | #137 | Excellent 13.1% |
| Brazilians | 84.5 /100 | #138 | Excellent 13.1% |
| Austrians | 83.7 /100 | #139 | Excellent 13.1% |
| Immigrants | Iraq | 83.6 /100 | #140 | Excellent 13.1% |
| New Zealanders | 83.4 /100 | #141 | Excellent 13.1% |
| Scandinavians | 82.3 /100 | #142 | Excellent 13.1% |
| Israelis | 81.9 /100 | #143 | Excellent 13.1% |
| Native Hawaiians | 78.9 /100 | #144 | Good 13.2% |
| Colombians | 77.2 /100 | #145 | Good 13.2% |
| South Americans | 76.9 /100 | #146 | Good 13.2% |
| Europeans | 76.8 /100 | #147 | Good 13.2% |
| Lebanese | 76.8 /100 | #148 | Good 13.2% |
| Sierra Leoneans | 76.3 /100 | #149 | Good 13.2% |
| Iraqis | 76.0 /100 | #150 | Good 13.2% |
| Costa Ricans | 75.8 /100 | #151 | Good 13.2% |
| Slavs | 75.7 /100 | #152 | Good 13.2% |
| Northern Europeans | 73.7 /100 | #153 | Good 13.2% |
| Arabs | 73.5 /100 | #154 | Good 13.2% |
| Immigrants | Sierra Leone | 72.9 /100 | #155 | Good 13.3% |
| Immigrants | Cameroon | 72.0 /100 | #156 | Good 13.3% |