Brazilian vs Immigrants from Egypt Child Poverty Among Boys Under 16
COMPARE
Brazilian
Immigrants from Egypt
Child Poverty Among Boys Under 16
Child Poverty Among Boys Under 16 Comparison
Brazilians
Immigrants from Egypt
15.8%
CHILD POVERTY AMONG BOYS UNDER 16
81.0/ 100
METRIC RATING
148th/ 347
METRIC RANK
14.9%
CHILD POVERTY AMONG BOYS UNDER 16
96.2/ 100
METRIC RATING
97th/ 347
METRIC RANK
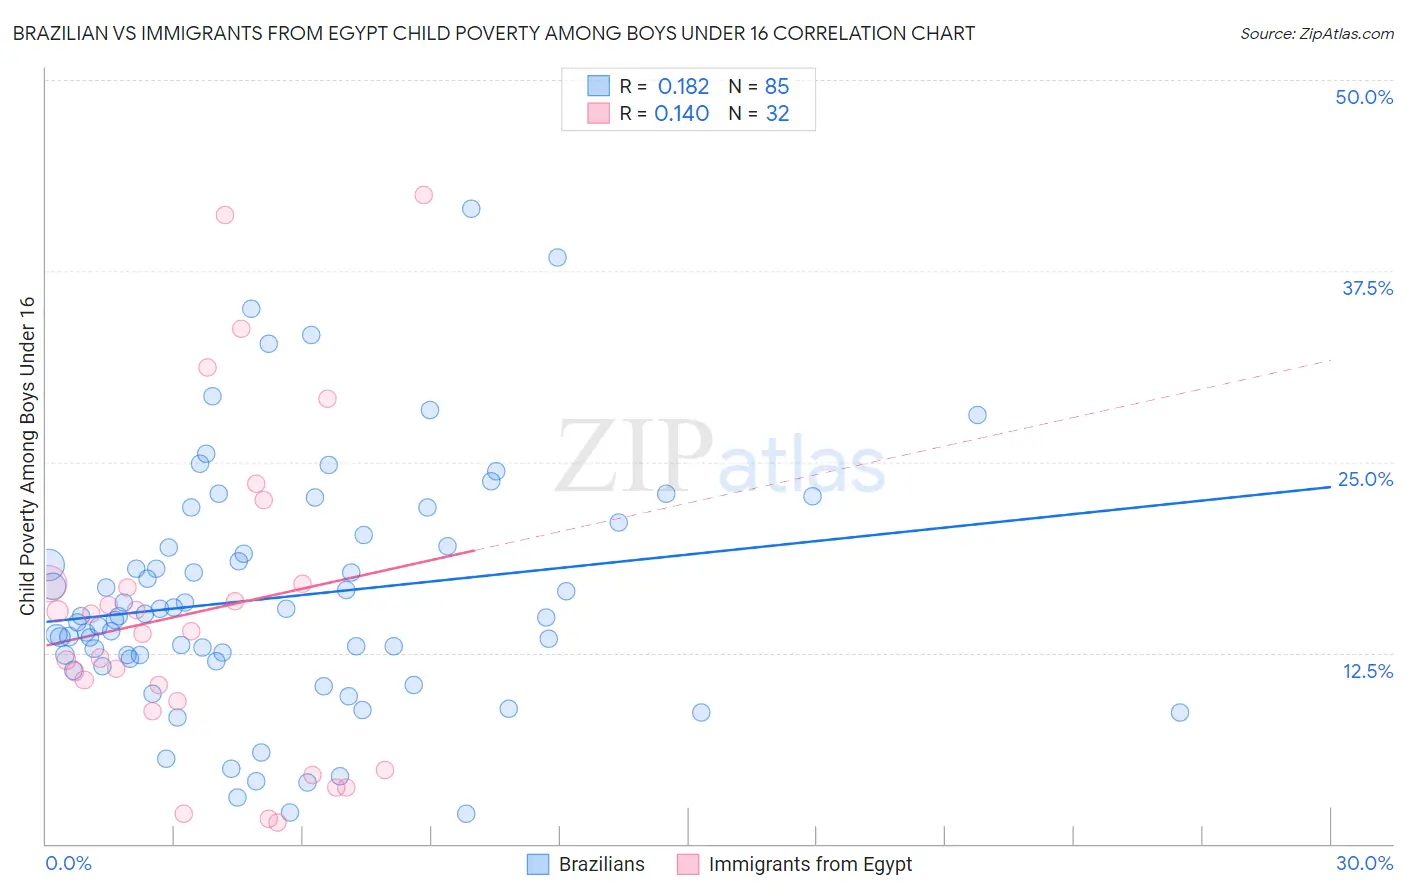
Brazilian vs Immigrants from Egypt Child Poverty Among Boys Under 16 Correlation Chart
The statistical analysis conducted on geographies consisting of 319,230,692 people shows a poor positive correlation between the proportion of Brazilians and poverty level among boys under the age of 16 in the United States with a correlation coefficient (R) of 0.182 and weighted average of 15.8%. Similarly, the statistical analysis conducted on geographies consisting of 242,739,180 people shows a poor positive correlation between the proportion of Immigrants from Egypt and poverty level among boys under the age of 16 in the United States with a correlation coefficient (R) of 0.140 and weighted average of 14.9%, a difference of 5.5%.
Child Poverty Among Boys Under 16 Correlation Summary
| Measurement | Brazilian | Immigrants from Egypt |
| Minimum | 1.9% | 1.4% |
| Maximum | 41.6% | 42.5% |
| Range | 39.6% | 41.1% |
| Mean | 16.2% | 15.2% |
| Median | 14.9% | 13.8% |
| Interquartile 25% (IQ1) | 12.1% | 9.0% |
| Interquartile 75% (IQ3) | 19.9% | 17.0% |
| Interquartile Range (IQR) | 7.8% | 8.0% |
| Standard Deviation (Sample) | 7.9% | 10.7% |
| Standard Deviation (Population) | 7.9% | 10.5% |
Similar Demographics by Child Poverty Among Boys Under 16
Demographics Similar to Brazilians by Child Poverty Among Boys Under 16
In terms of child poverty among boys under 16, the demographic groups most similar to Brazilians are Slovak (15.8%, a difference of 0.14%), Immigrants from Jordan (15.8%, a difference of 0.15%), Venezuelan (15.7%, a difference of 0.20%), Puget Sound Salish (15.8%, a difference of 0.23%), and New Zealander (15.7%, a difference of 0.27%).
| Demographics | Rating | Rank | Child Poverty Among Boys Under 16 |
| Slavs | 84.5 /100 | #141 | Excellent 15.7% |
| Immigrants | Hungary | 84.1 /100 | #142 | Excellent 15.7% |
| Immigrants | Fiji | 83.6 /100 | #143 | Excellent 15.7% |
| Immigrants | Peru | 83.5 /100 | #144 | Excellent 15.7% |
| Samoans | 83.2 /100 | #145 | Excellent 15.7% |
| New Zealanders | 82.4 /100 | #146 | Excellent 15.7% |
| Venezuelans | 82.1 /100 | #147 | Excellent 15.7% |
| Brazilians | 81.0 /100 | #148 | Excellent 15.8% |
| Slovaks | 80.3 /100 | #149 | Excellent 15.8% |
| Immigrants | Jordan | 80.2 /100 | #150 | Excellent 15.8% |
| Puget Sound Salish | 79.8 /100 | #151 | Good 15.8% |
| Immigrants | Venezuela | 79.5 /100 | #152 | Good 15.8% |
| French | 78.7 /100 | #153 | Good 15.8% |
| Syrians | 77.5 /100 | #154 | Good 15.9% |
| French Canadians | 76.6 /100 | #155 | Good 15.9% |
Demographics Similar to Immigrants from Egypt by Child Poverty Among Boys Under 16
In terms of child poverty among boys under 16, the demographic groups most similar to Immigrants from Egypt are Immigrants from North Macedonia (14.9%, a difference of 0.010%), British (15.0%, a difference of 0.040%), Immigrants from France (15.0%, a difference of 0.14%), Finnish (14.9%, a difference of 0.26%), and Sri Lankan (14.9%, a difference of 0.37%).
| Demographics | Rating | Rank | Child Poverty Among Boys Under 16 |
| Austrians | 97.1 /100 | #90 | Exceptional 14.8% |
| Paraguayans | 96.8 /100 | #91 | Exceptional 14.9% |
| Argentineans | 96.7 /100 | #92 | Exceptional 14.9% |
| Sri Lankans | 96.7 /100 | #93 | Exceptional 14.9% |
| Immigrants | Italy | 96.7 /100 | #94 | Exceptional 14.9% |
| Finns | 96.5 /100 | #95 | Exceptional 14.9% |
| Immigrants | North Macedonia | 96.3 /100 | #96 | Exceptional 14.9% |
| Immigrants | Egypt | 96.2 /100 | #97 | Exceptional 14.9% |
| British | 96.2 /100 | #98 | Exceptional 15.0% |
| Immigrants | France | 96.1 /100 | #99 | Exceptional 15.0% |
| Chileans | 95.8 /100 | #100 | Exceptional 15.0% |
| Immigrants | Belarus | 95.7 /100 | #101 | Exceptional 15.0% |
| Romanians | 95.6 /100 | #102 | Exceptional 15.0% |
| Immigrants | Denmark | 95.6 /100 | #103 | Exceptional 15.0% |
| Immigrants | Switzerland | 95.4 /100 | #104 | Exceptional 15.0% |