Brazilian vs Immigrants from Argentina Child Poverty Under the Age of 16
COMPARE
Brazilian
Immigrants from Argentina
Child Poverty Under the Age of 16
Child Poverty Under the Age of 16 Comparison
Brazilians
Immigrants from Argentina
15.4%
CHILD POVERTY UNDER THE AGE OF 16
82.8/ 100
METRIC RATING
142nd/ 347
METRIC RANK
14.5%
CHILD POVERTY UNDER THE AGE OF 16
97.1/ 100
METRIC RATING
86th/ 347
METRIC RANK
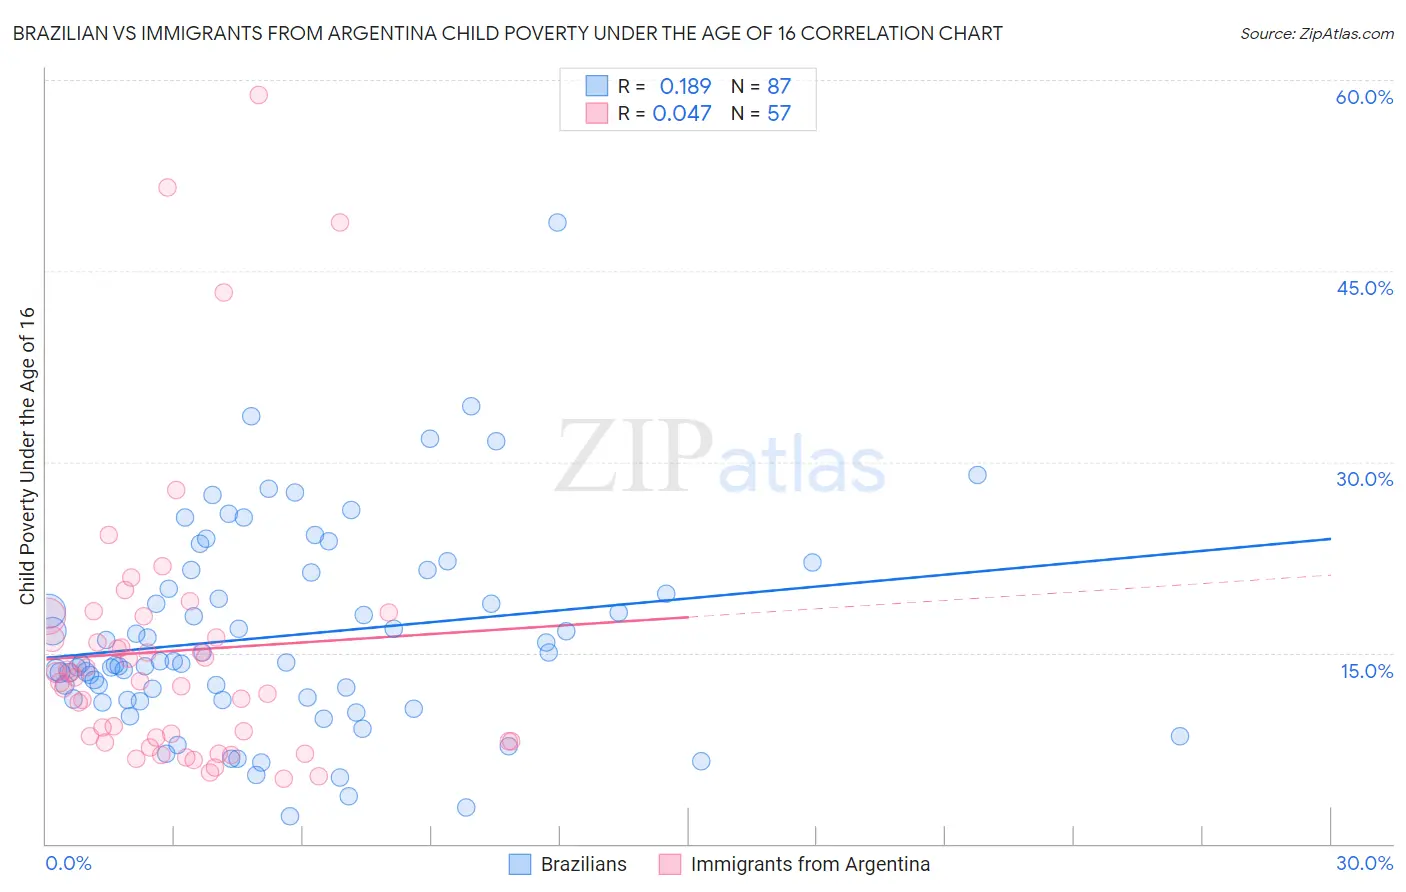
Brazilian vs Immigrants from Argentina Child Poverty Under the Age of 16 Correlation Chart
The statistical analysis conducted on geographies consisting of 321,388,637 people shows a poor positive correlation between the proportion of Brazilians and poverty level among children under the age of 16 in the United States with a correlation coefficient (R) of 0.189 and weighted average of 15.4%. Similarly, the statistical analysis conducted on geographies consisting of 262,825,580 people shows no correlation between the proportion of Immigrants from Argentina and poverty level among children under the age of 16 in the United States with a correlation coefficient (R) of 0.047 and weighted average of 14.5%, a difference of 6.5%.
Child Poverty Under the Age of 16 Correlation Summary
| Measurement | Brazilian | Immigrants from Argentina |
| Minimum | 2.2% | 5.1% |
| Maximum | 48.8% | 58.8% |
| Range | 46.6% | 53.7% |
| Mean | 16.3% | 15.2% |
| Median | 14.3% | 12.8% |
| Interquartile 25% (IQ1) | 11.3% | 8.0% |
| Interquartile 75% (IQ3) | 21.3% | 17.0% |
| Interquartile Range (IQR) | 10.0% | 9.0% |
| Standard Deviation (Sample) | 8.0% | 11.1% |
| Standard Deviation (Population) | 8.0% | 11.0% |
Similar Demographics by Child Poverty Under the Age of 16
Demographics Similar to Brazilians by Child Poverty Under the Age of 16
In terms of child poverty under the age of 16, the demographic groups most similar to Brazilians are Icelander (15.4%, a difference of 0.070%), Immigrants from Hungary (15.5%, a difference of 0.19%), Immigrants from Peru (15.5%, a difference of 0.24%), Slovak (15.5%, a difference of 0.28%), and Slavic (15.4%, a difference of 0.34%).
| Demographics | Rating | Rank | Child Poverty Under the Age of 16 |
| Albanians | 88.6 /100 | #135 | Excellent 15.2% |
| Immigrants | Spain | 87.3 /100 | #136 | Excellent 15.3% |
| Peruvians | 87.2 /100 | #137 | Excellent 15.3% |
| Welsh | 87.2 /100 | #138 | Excellent 15.3% |
| Immigrants | Vietnam | 87.1 /100 | #139 | Excellent 15.3% |
| New Zealanders | 86.9 /100 | #140 | Excellent 15.3% |
| Slavs | 84.2 /100 | #141 | Excellent 15.4% |
| Brazilians | 82.8 /100 | #142 | Excellent 15.4% |
| Icelanders | 82.5 /100 | #143 | Excellent 15.4% |
| Immigrants | Hungary | 81.9 /100 | #144 | Excellent 15.5% |
| Immigrants | Peru | 81.7 /100 | #145 | Excellent 15.5% |
| Slovaks | 81.4 /100 | #146 | Excellent 15.5% |
| Immigrants | Kuwait | 80.5 /100 | #147 | Excellent 15.5% |
| Puget Sound Salish | 80.3 /100 | #148 | Excellent 15.5% |
| Israelis | 80.1 /100 | #149 | Excellent 15.5% |
Demographics Similar to Immigrants from Argentina by Child Poverty Under the Age of 16
In terms of child poverty under the age of 16, the demographic groups most similar to Immigrants from Argentina are Taiwanese (14.5%, a difference of 0.0%), Soviet Union (14.5%, a difference of 0.080%), Immigrants from Latvia (14.5%, a difference of 0.10%), Northern European (14.5%, a difference of 0.10%), and Egyptian (14.5%, a difference of 0.12%).
| Demographics | Rating | Rank | Child Poverty Under the Age of 16 |
| Swiss | 97.3 /100 | #79 | Exceptional 14.5% |
| Immigrants | North Macedonia | 97.2 /100 | #80 | Exceptional 14.5% |
| Finns | 97.2 /100 | #81 | Exceptional 14.5% |
| Immigrants | Canada | 97.2 /100 | #82 | Exceptional 14.5% |
| Egyptians | 97.2 /100 | #83 | Exceptional 14.5% |
| Immigrants | Latvia | 97.1 /100 | #84 | Exceptional 14.5% |
| Soviet Union | 97.1 /100 | #85 | Exceptional 14.5% |
| Immigrants | Argentina | 97.1 /100 | #86 | Exceptional 14.5% |
| Taiwanese | 97.1 /100 | #87 | Exceptional 14.5% |
| Northern Europeans | 97.0 /100 | #88 | Exceptional 14.5% |
| Germans | 96.9 /100 | #89 | Exceptional 14.5% |
| Austrians | 96.9 /100 | #90 | Exceptional 14.5% |
| Immigrants | North America | 96.7 /100 | #91 | Exceptional 14.6% |
| Immigrants | Italy | 96.7 /100 | #92 | Exceptional 14.6% |
| Argentineans | 96.6 /100 | #93 | Exceptional 14.6% |