Brazilian vs French American Indian Single Father Poverty
COMPARE
Brazilian
French American Indian
Single Father Poverty
Single Father Poverty Comparison
Brazilians
French American Indians
15.5%
SINGLE FATHER POVERTY
99.0/ 100
METRIC RATING
87th/ 347
METRIC RANK
17.4%
SINGLE FATHER POVERTY
0.2/ 100
METRIC RATING
271st/ 347
METRIC RANK
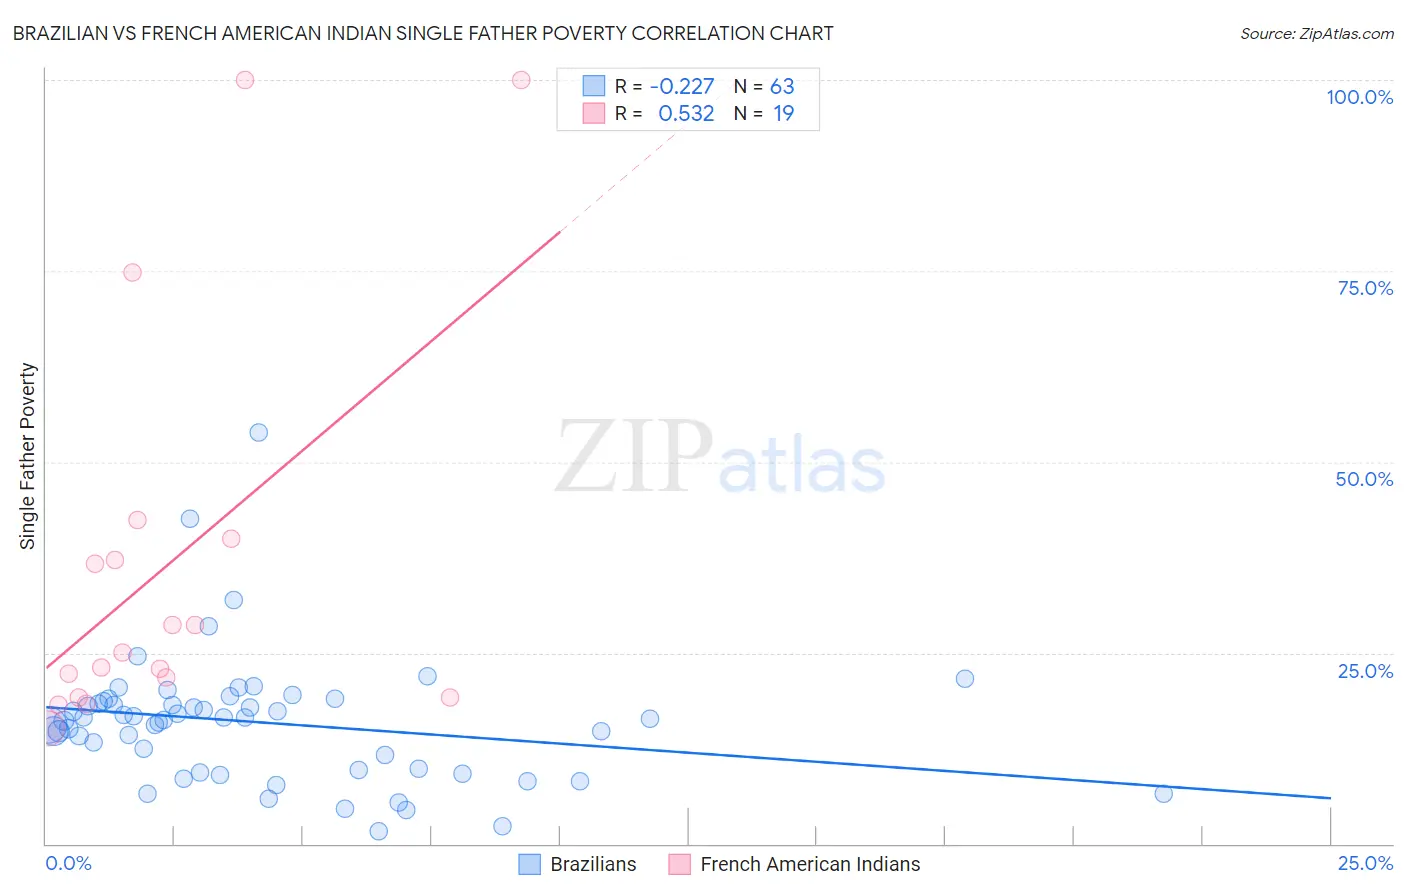
Brazilian vs French American Indian Single Father Poverty Correlation Chart
The statistical analysis conducted on geographies consisting of 259,661,498 people shows a weak negative correlation between the proportion of Brazilians and poverty level among single fathers in the United States with a correlation coefficient (R) of -0.227 and weighted average of 15.5%. Similarly, the statistical analysis conducted on geographies consisting of 117,658,410 people shows a substantial positive correlation between the proportion of French American Indians and poverty level among single fathers in the United States with a correlation coefficient (R) of 0.532 and weighted average of 17.4%, a difference of 12.8%.
Single Father Poverty Correlation Summary
| Measurement | Brazilian | French American Indian |
| Minimum | 1.7% | 15.1% |
| Maximum | 53.9% | 100.0% |
| Range | 52.2% | 84.9% |
| Mean | 15.9% | 36.5% |
| Median | 16.4% | 25.0% |
| Interquartile 25% (IQ1) | 9.6% | 19.2% |
| Interquartile 75% (IQ3) | 18.7% | 40.0% |
| Interquartile Range (IQR) | 9.1% | 20.8% |
| Standard Deviation (Sample) | 8.4% | 26.2% |
| Standard Deviation (Population) | 8.4% | 25.5% |
Similar Demographics by Single Father Poverty
Demographics Similar to Brazilians by Single Father Poverty
In terms of single father poverty, the demographic groups most similar to Brazilians are Immigrants from Russia (15.5%, a difference of 0.0%), Burmese (15.5%, a difference of 0.030%), Immigrants from Korea (15.5%, a difference of 0.090%), Immigrants from Oceania (15.4%, a difference of 0.13%), and Peruvian (15.4%, a difference of 0.24%).
| Demographics | Rating | Rank | Single Father Poverty |
| Armenians | 99.4 /100 | #80 | Exceptional 15.4% |
| Immigrants | Congo | 99.4 /100 | #81 | Exceptional 15.4% |
| Immigrants | Ukraine | 99.4 /100 | #82 | Exceptional 15.4% |
| Chinese | 99.3 /100 | #83 | Exceptional 15.4% |
| Peruvians | 99.2 /100 | #84 | Exceptional 15.4% |
| Immigrants | Oceania | 99.1 /100 | #85 | Exceptional 15.4% |
| Immigrants | Russia | 99.0 /100 | #86 | Exceptional 15.5% |
| Brazilians | 99.0 /100 | #87 | Exceptional 15.5% |
| Burmese | 99.0 /100 | #88 | Exceptional 15.5% |
| Immigrants | Korea | 99.0 /100 | #89 | Exceptional 15.5% |
| Mexican American Indians | 98.7 /100 | #90 | Exceptional 15.5% |
| Immigrants | Romania | 98.6 /100 | #91 | Exceptional 15.5% |
| Immigrants | Serbia | 98.5 /100 | #92 | Exceptional 15.5% |
| Basques | 98.4 /100 | #93 | Exceptional 15.5% |
| Immigrants | Uruguay | 98.2 /100 | #94 | Exceptional 15.6% |
Demographics Similar to French American Indians by Single Father Poverty
In terms of single father poverty, the demographic groups most similar to French American Indians are Indonesian (17.4%, a difference of 0.14%), Barbadian (17.5%, a difference of 0.35%), Slavic (17.4%, a difference of 0.40%), Immigrants from Caribbean (17.4%, a difference of 0.47%), and Haitian (17.3%, a difference of 0.57%).
| Demographics | Rating | Rank | Single Father Poverty |
| Slovenes | 0.3 /100 | #264 | Tragic 17.3% |
| Poles | 0.3 /100 | #265 | Tragic 17.3% |
| Jamaicans | 0.3 /100 | #266 | Tragic 17.3% |
| Haitians | 0.3 /100 | #267 | Tragic 17.3% |
| Immigrants | Caribbean | 0.3 /100 | #268 | Tragic 17.4% |
| Slavs | 0.3 /100 | #269 | Tragic 17.4% |
| Indonesians | 0.2 /100 | #270 | Tragic 17.4% |
| French American Indians | 0.2 /100 | #271 | Tragic 17.4% |
| Barbadians | 0.1 /100 | #272 | Tragic 17.5% |
| Italians | 0.1 /100 | #273 | Tragic 17.5% |
| Macedonians | 0.1 /100 | #274 | Tragic 17.7% |
| British West Indians | 0.0 /100 | #275 | Tragic 17.7% |
| German Russians | 0.0 /100 | #276 | Tragic 17.7% |
| Lebanese | 0.0 /100 | #277 | Tragic 17.7% |
| Germans | 0.0 /100 | #278 | Tragic 17.7% |