Bolivian vs Argentinean Seniors Poverty Over the Age of 65
COMPARE
Bolivian
Argentinean
Seniors Poverty Over the Age of 65
Seniors Poverty Over the Age of 65 Comparison
Bolivians
Argentineans
9.8%
SENIORS POVERTY OVER THE AGE OF 65
99.1/ 100
METRIC RATING
57th/ 347
METRIC RANK
11.7%
SENIORS POVERTY OVER THE AGE OF 65
4.1/ 100
METRIC RATING
221st/ 347
METRIC RANK
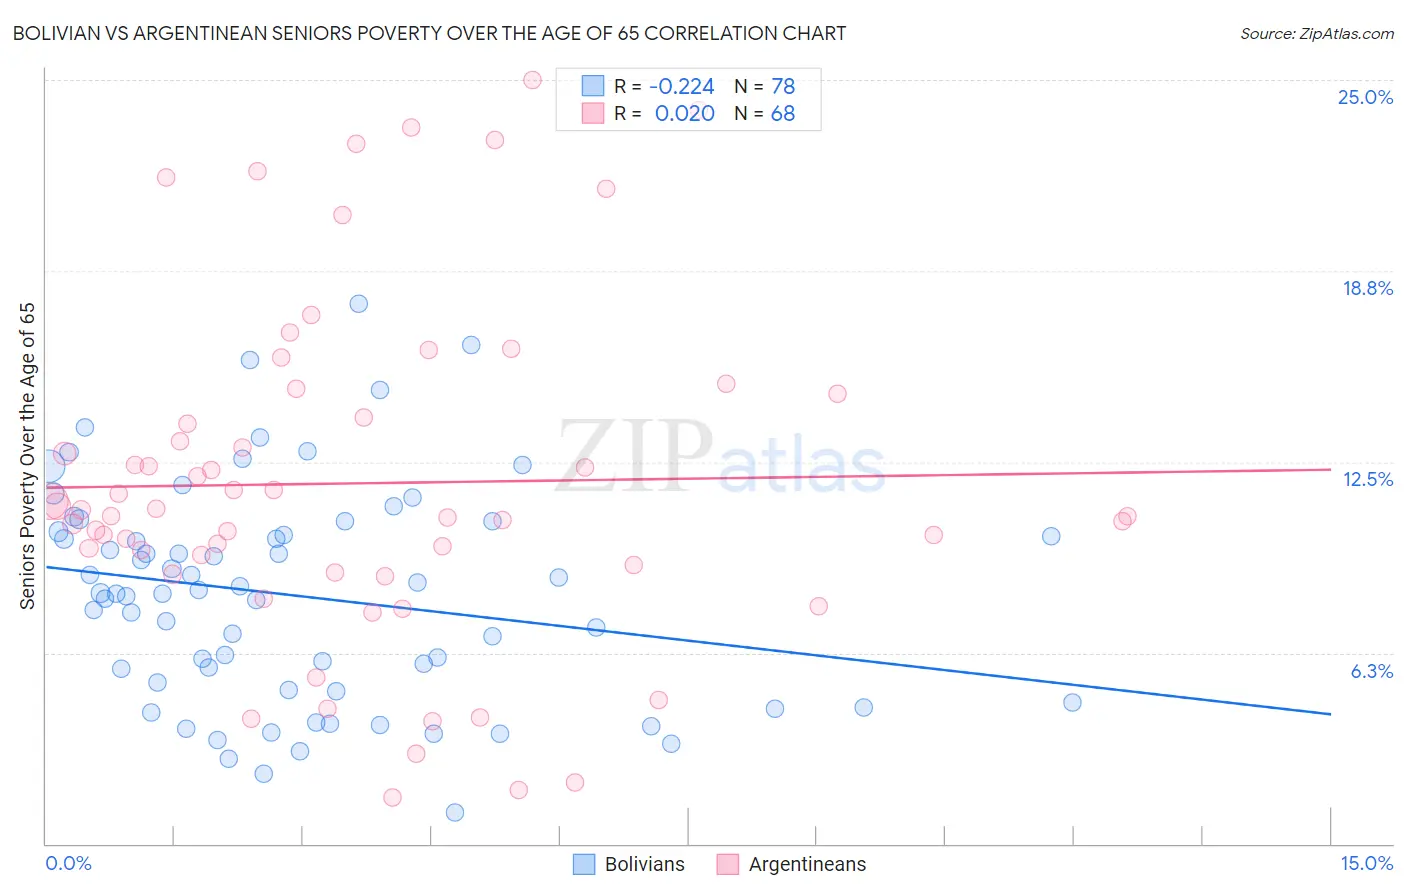
Bolivian vs Argentinean Seniors Poverty Over the Age of 65 Correlation Chart
The statistical analysis conducted on geographies consisting of 184,345,145 people shows a weak negative correlation between the proportion of Bolivians and poverty level among seniors over the age of 65 in the United States with a correlation coefficient (R) of -0.224 and weighted average of 9.8%. Similarly, the statistical analysis conducted on geographies consisting of 296,547,571 people shows no correlation between the proportion of Argentineans and poverty level among seniors over the age of 65 in the United States with a correlation coefficient (R) of 0.020 and weighted average of 11.7%, a difference of 19.4%.
Seniors Poverty Over the Age of 65 Correlation Summary
| Measurement | Bolivian | Argentinean |
| Minimum | 1.0% | 1.5% |
| Maximum | 17.7% | 25.0% |
| Range | 16.7% | 23.5% |
| Mean | 8.1% | 11.8% |
| Median | 8.2% | 10.8% |
| Interquartile 25% (IQ1) | 5.0% | 9.0% |
| Interquartile 75% (IQ3) | 10.2% | 14.3% |
| Interquartile Range (IQR) | 5.2% | 5.3% |
| Standard Deviation (Sample) | 3.6% | 5.6% |
| Standard Deviation (Population) | 3.5% | 5.5% |
Similar Demographics by Seniors Poverty Over the Age of 65
Demographics Similar to Bolivians by Seniors Poverty Over the Age of 65
In terms of seniors poverty over the age of 65, the demographic groups most similar to Bolivians are Serbian (9.8%, a difference of 0.060%), Immigrants from England (9.8%, a difference of 0.12%), Immigrants from Canada (9.8%, a difference of 0.21%), Afghan (9.8%, a difference of 0.24%), and Celtic (9.8%, a difference of 0.25%).
| Demographics | Rating | Rank | Seniors Poverty Over the Age of 65 |
| Hungarians | 99.4 /100 | #50 | Exceptional 9.7% |
| Carpatho Rusyns | 99.3 /100 | #51 | Exceptional 9.7% |
| Filipinos | 99.3 /100 | #52 | Exceptional 9.7% |
| Slavs | 99.2 /100 | #53 | Exceptional 9.8% |
| Immigrants | Northern Europe | 99.2 /100 | #54 | Exceptional 9.8% |
| Afghans | 99.2 /100 | #55 | Exceptional 9.8% |
| Immigrants | England | 99.1 /100 | #56 | Exceptional 9.8% |
| Bolivians | 99.1 /100 | #57 | Exceptional 9.8% |
| Serbians | 99.1 /100 | #58 | Exceptional 9.8% |
| Immigrants | Canada | 99.0 /100 | #59 | Exceptional 9.8% |
| Celtics | 99.0 /100 | #60 | Exceptional 9.8% |
| Iranians | 98.9 /100 | #61 | Exceptional 9.8% |
| French Canadians | 98.9 /100 | #62 | Exceptional 9.8% |
| Macedonians | 98.8 /100 | #63 | Exceptional 9.9% |
| Immigrants | North America | 98.8 /100 | #64 | Exceptional 9.9% |
Demographics Similar to Argentineans by Seniors Poverty Over the Age of 65
In terms of seniors poverty over the age of 65, the demographic groups most similar to Argentineans are Peruvian (11.7%, a difference of 0.070%), Immigrants from Chile (11.7%, a difference of 0.12%), Immigrants from Congo (11.7%, a difference of 0.15%), Immigrants from Nigeria (11.7%, a difference of 0.39%), and Immigrants from Belarus (11.8%, a difference of 0.49%).
| Demographics | Rating | Rank | Seniors Poverty Over the Age of 65 |
| Immigrants | Russia | 8.8 /100 | #214 | Tragic 11.5% |
| French American Indians | 8.7 /100 | #215 | Tragic 11.5% |
| Immigrants | Morocco | 6.8 /100 | #216 | Tragic 11.6% |
| Immigrants | Africa | 6.4 /100 | #217 | Tragic 11.6% |
| Immigrants | Ukraine | 5.7 /100 | #218 | Tragic 11.6% |
| Arapaho | 5.2 /100 | #219 | Tragic 11.6% |
| Peruvians | 4.2 /100 | #220 | Tragic 11.7% |
| Argentineans | 4.1 /100 | #221 | Tragic 11.7% |
| Immigrants | Chile | 3.9 /100 | #222 | Tragic 11.7% |
| Immigrants | Congo | 3.8 /100 | #223 | Tragic 11.7% |
| Immigrants | Nigeria | 3.4 /100 | #224 | Tragic 11.7% |
| Immigrants | Belarus | 3.2 /100 | #225 | Tragic 11.8% |
| Liberians | 3.2 /100 | #226 | Tragic 11.8% |
| Nigerians | 3.2 /100 | #227 | Tragic 11.8% |
| Immigrants | Costa Rica | 2.7 /100 | #228 | Tragic 11.8% |