Black/African American vs Kenyan Child Poverty Among Boys Under 16
COMPARE
Black/African American
Kenyan
Child Poverty Among Boys Under 16
Child Poverty Among Boys Under 16 Comparison
Blacks/African Americans
Kenyans
24.5%
CHILD POVERTY AMONG BOYS UNDER 16
0.0/ 100
METRIC RATING
334th/ 347
METRIC RANK
16.6%
CHILD POVERTY AMONG BOYS UNDER 16
41.0/ 100
METRIC RATING
183rd/ 347
METRIC RANK
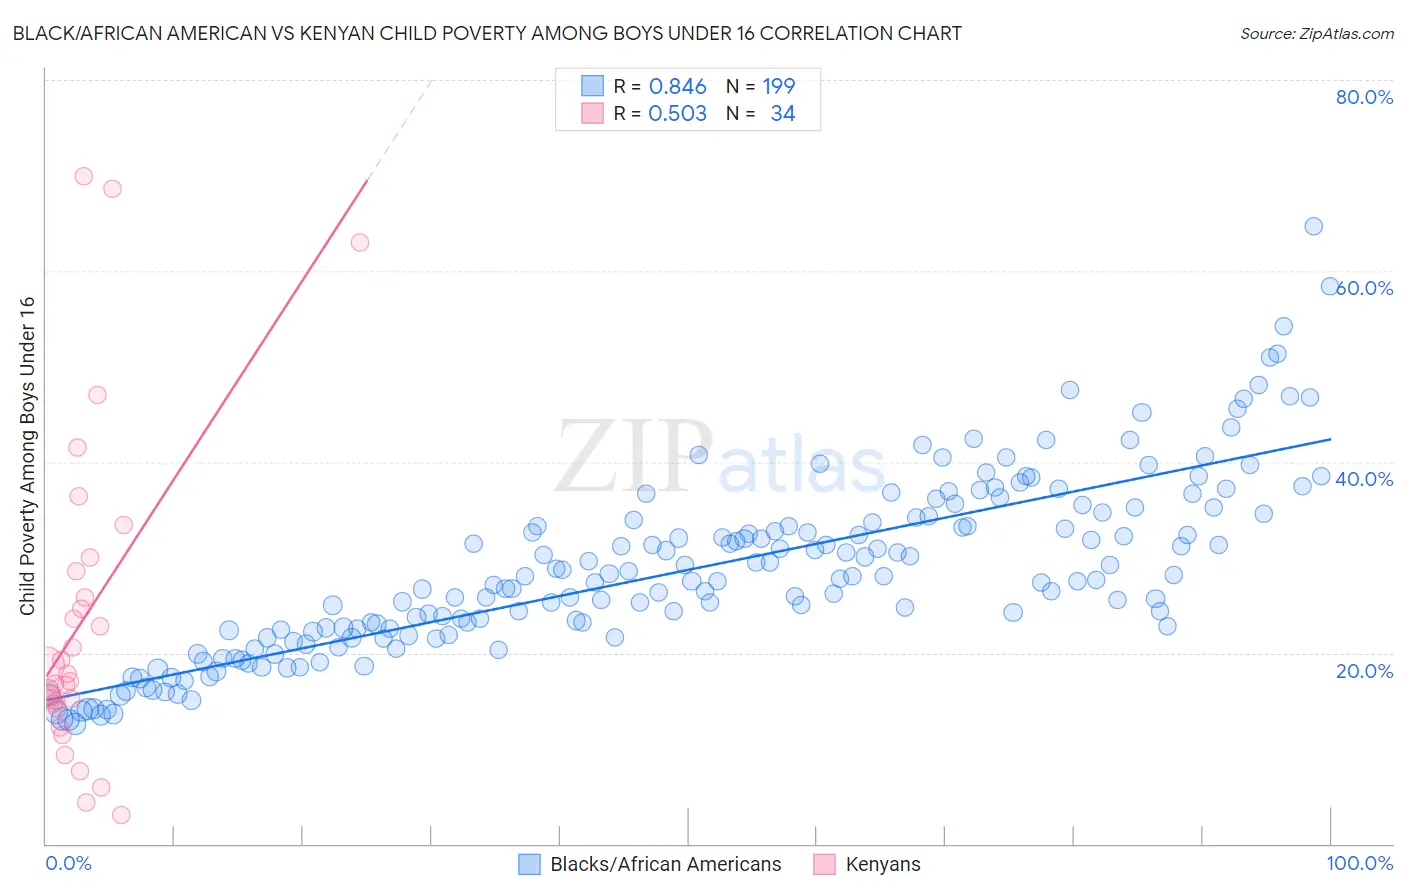
Black/African American vs Kenyan Child Poverty Among Boys Under 16 Correlation Chart
The statistical analysis conducted on geographies consisting of 548,051,875 people shows a very strong positive correlation between the proportion of Blacks/African Americans and poverty level among boys under the age of 16 in the United States with a correlation coefficient (R) of 0.846 and weighted average of 24.5%. Similarly, the statistical analysis conducted on geographies consisting of 167,427,492 people shows a substantial positive correlation between the proportion of Kenyans and poverty level among boys under the age of 16 in the United States with a correlation coefficient (R) of 0.503 and weighted average of 16.6%, a difference of 47.7%.
Child Poverty Among Boys Under 16 Correlation Summary
| Measurement | Black/African American | Kenyan |
| Minimum | 12.5% | 3.0% |
| Maximum | 64.6% | 70.0% |
| Range | 52.1% | 66.9% |
| Mean | 28.6% | 23.6% |
| Median | 27.6% | 17.5% |
| Interquartile 25% (IQ1) | 21.9% | 14.7% |
| Interquartile 75% (IQ3) | 34.0% | 28.5% |
| Interquartile Range (IQR) | 12.1% | 13.9% |
| Standard Deviation (Sample) | 9.3% | 17.0% |
| Standard Deviation (Population) | 9.3% | 16.7% |
Similar Demographics by Child Poverty Among Boys Under 16
Demographics Similar to Blacks/African Americans by Child Poverty Among Boys Under 16
In terms of child poverty among boys under 16, the demographic groups most similar to Blacks/African Americans are Apache (24.5%, a difference of 0.12%), Immigrants from Dominican Republic (24.3%, a difference of 0.84%), Yup'ik (24.7%, a difference of 0.85%), Dominican (24.2%, a difference of 1.4%), and Colville (24.1%, a difference of 1.8%).
| Demographics | Rating | Rank | Child Poverty Among Boys Under 16 |
| Immigrants | Honduras | 0.0 /100 | #327 | Tragic 22.8% |
| Pueblo | 0.0 /100 | #328 | Tragic 23.5% |
| Natives/Alaskans | 0.0 /100 | #329 | Tragic 24.0% |
| Colville | 0.0 /100 | #330 | Tragic 24.1% |
| Dominicans | 0.0 /100 | #331 | Tragic 24.2% |
| Immigrants | Dominican Republic | 0.0 /100 | #332 | Tragic 24.3% |
| Apache | 0.0 /100 | #333 | Tragic 24.5% |
| Blacks/African Americans | 0.0 /100 | #334 | Tragic 24.5% |
| Yup'ik | 0.0 /100 | #335 | Tragic 24.7% |
| Sioux | 0.0 /100 | #336 | Tragic 25.3% |
| Cheyenne | 0.0 /100 | #337 | Tragic 25.8% |
| Hopi | 0.0 /100 | #338 | Tragic 25.9% |
| Houma | 0.0 /100 | #339 | Tragic 26.2% |
| Crow | 0.0 /100 | #340 | Tragic 26.3% |
| Immigrants | Yemen | 0.0 /100 | #341 | Tragic 28.9% |
Demographics Similar to Kenyans by Child Poverty Among Boys Under 16
In terms of child poverty among boys under 16, the demographic groups most similar to Kenyans are Celtic (16.6%, a difference of 0.040%), Immigrants from Western Asia (16.6%, a difference of 0.070%), Lebanese (16.6%, a difference of 0.27%), Hmong (16.6%, a difference of 0.29%), and Immigrants from Costa Rica (16.7%, a difference of 0.37%).
| Demographics | Rating | Rank | Child Poverty Among Boys Under 16 |
| Whites/Caucasians | 48.2 /100 | #176 | Average 16.5% |
| Ethiopians | 47.8 /100 | #177 | Average 16.5% |
| Scotch-Irish | 47.5 /100 | #178 | Average 16.5% |
| Hungarians | 47.3 /100 | #179 | Average 16.5% |
| Hawaiians | 45.5 /100 | #180 | Average 16.5% |
| South American Indians | 44.3 /100 | #181 | Average 16.5% |
| Lebanese | 43.3 /100 | #182 | Average 16.6% |
| Kenyans | 41.0 /100 | #183 | Average 16.6% |
| Celtics | 40.6 /100 | #184 | Average 16.6% |
| Immigrants | Western Asia | 40.4 /100 | #185 | Average 16.6% |
| Hmong | 38.4 /100 | #186 | Fair 16.6% |
| Immigrants | Costa Rica | 37.8 /100 | #187 | Fair 16.7% |
| Immigrants | South America | 37.7 /100 | #188 | Fair 16.7% |
| Immigrants | Morocco | 34.5 /100 | #189 | Fair 16.7% |
| Arabs | 31.1 /100 | #190 | Fair 16.8% |