Black/African American vs Colombian Single Male Poverty
COMPARE
Black/African American
Colombian
Single Male Poverty
Single Male Poverty Comparison
Blacks/African Americans
Colombians
16.2%
SINGLE MALE POVERTY
0.0/ 100
METRIC RATING
317th/ 347
METRIC RANK
12.2%
SINGLE MALE POVERTY
97.8/ 100
METRIC RATING
94th/ 347
METRIC RANK
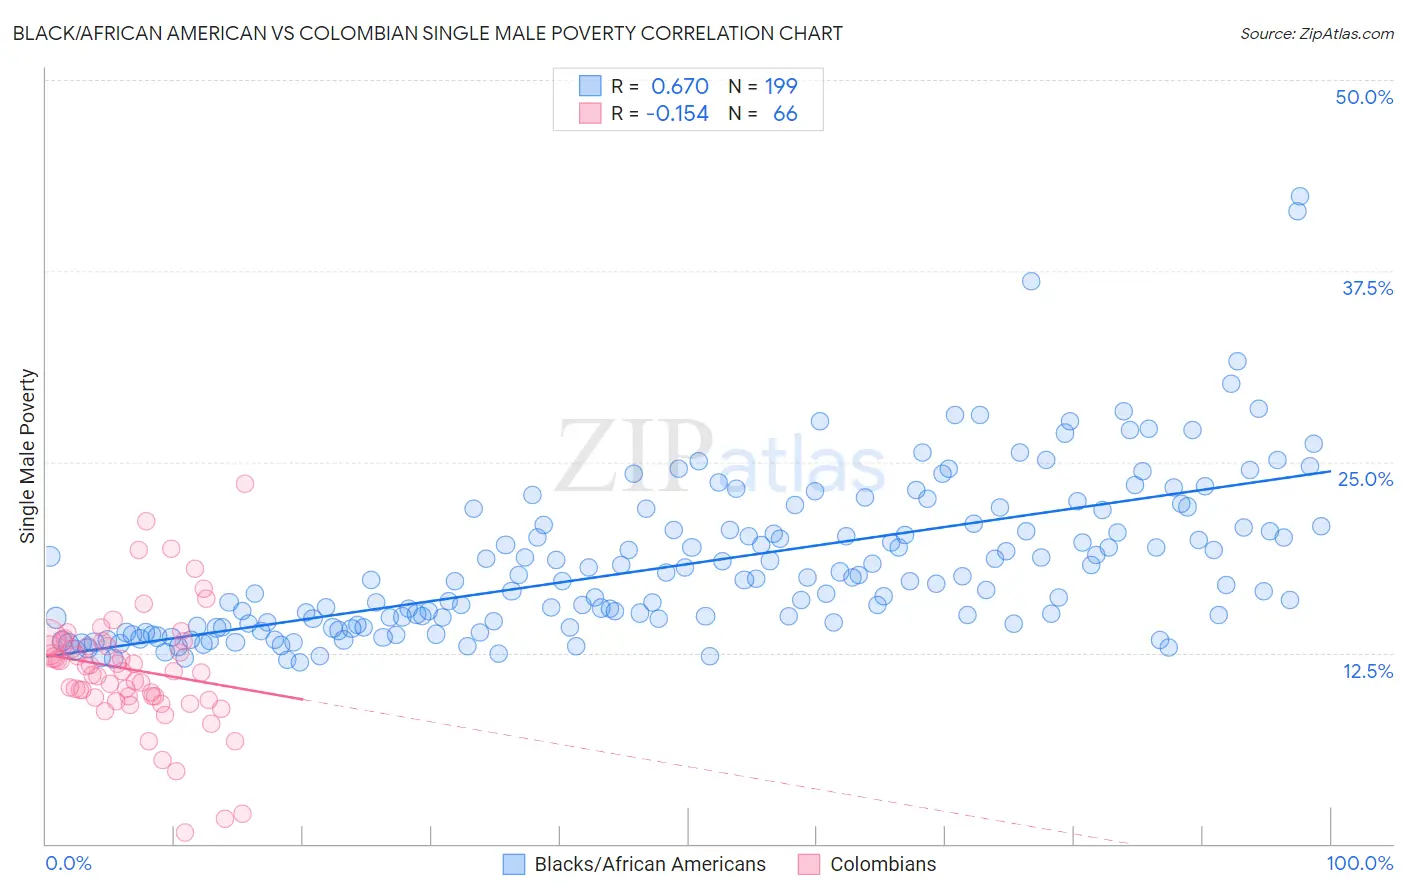
Black/African American vs Colombian Single Male Poverty Correlation Chart
The statistical analysis conducted on geographies consisting of 472,674,082 people shows a significant positive correlation between the proportion of Blacks/African Americans and poverty level among single males in the United States with a correlation coefficient (R) of 0.670 and weighted average of 16.2%. Similarly, the statistical analysis conducted on geographies consisting of 370,615,335 people shows a poor negative correlation between the proportion of Colombians and poverty level among single males in the United States with a correlation coefficient (R) of -0.154 and weighted average of 12.2%, a difference of 33.1%.
Single Male Poverty Correlation Summary
| Measurement | Black/African American | Colombian |
| Minimum | 11.9% | 0.77% |
| Maximum | 42.4% | 23.6% |
| Range | 30.6% | 22.8% |
| Mean | 18.3% | 11.4% |
| Median | 17.2% | 11.3% |
| Interquartile 25% (IQ1) | 14.2% | 9.6% |
| Interquartile 75% (IQ3) | 20.7% | 13.2% |
| Interquartile Range (IQR) | 6.5% | 3.6% |
| Standard Deviation (Sample) | 5.2% | 4.0% |
| Standard Deviation (Population) | 5.2% | 4.0% |
Similar Demographics by Single Male Poverty
Demographics Similar to Blacks/African Americans by Single Male Poverty
In terms of single male poverty, the demographic groups most similar to Blacks/African Americans are Dutch West Indian (16.1%, a difference of 0.34%), Cheyenne (16.1%, a difference of 0.48%), Alaskan Athabascan (16.1%, a difference of 0.53%), Chickasaw (16.3%, a difference of 0.80%), and Cherokee (16.1%, a difference of 0.82%).
| Demographics | Rating | Rank | Single Male Poverty |
| Yakama | 0.0 /100 | #310 | Tragic 15.9% |
| Seminole | 0.0 /100 | #311 | Tragic 16.0% |
| Comanche | 0.0 /100 | #312 | Tragic 16.0% |
| Cherokee | 0.0 /100 | #313 | Tragic 16.1% |
| Alaskan Athabascans | 0.0 /100 | #314 | Tragic 16.1% |
| Cheyenne | 0.0 /100 | #315 | Tragic 16.1% |
| Dutch West Indians | 0.0 /100 | #316 | Tragic 16.1% |
| Blacks/African Americans | 0.0 /100 | #317 | Tragic 16.2% |
| Chickasaw | 0.0 /100 | #318 | Tragic 16.3% |
| Chippewa | 0.0 /100 | #319 | Tragic 16.4% |
| Marshallese | 0.0 /100 | #320 | Tragic 16.4% |
| Osage | 0.0 /100 | #321 | Tragic 16.5% |
| Shoshone | 0.0 /100 | #322 | Tragic 16.7% |
| Creek | 0.0 /100 | #323 | Tragic 16.8% |
| Immigrants | Yemen | 0.0 /100 | #324 | Tragic 16.9% |
Demographics Similar to Colombians by Single Male Poverty
In terms of single male poverty, the demographic groups most similar to Colombians are Mongolian (12.2%, a difference of 0.010%), Immigrants from Bosnia and Herzegovina (12.1%, a difference of 0.12%), Immigrants from Sweden (12.2%, a difference of 0.16%), Spanish American Indian (12.1%, a difference of 0.18%), and Immigrants from Italy (12.2%, a difference of 0.21%).
| Demographics | Rating | Rank | Single Male Poverty |
| South Americans | 98.5 /100 | #87 | Exceptional 12.1% |
| Immigrants | Eritrea | 98.5 /100 | #88 | Exceptional 12.1% |
| Immigrants | Ireland | 98.3 /100 | #89 | Exceptional 12.1% |
| South American Indians | 98.3 /100 | #90 | Exceptional 12.1% |
| Immigrants | Turkey | 98.2 /100 | #91 | Exceptional 12.1% |
| Spanish American Indians | 98.0 /100 | #92 | Exceptional 12.1% |
| Immigrants | Bosnia and Herzegovina | 97.9 /100 | #93 | Exceptional 12.1% |
| Colombians | 97.8 /100 | #94 | Exceptional 12.2% |
| Mongolians | 97.7 /100 | #95 | Exceptional 12.2% |
| Immigrants | Sweden | 97.5 /100 | #96 | Exceptional 12.2% |
| Immigrants | Italy | 97.4 /100 | #97 | Exceptional 12.2% |
| Guamanians/Chamorros | 97.4 /100 | #98 | Exceptional 12.2% |
| Immigrants | Cuba | 97.3 /100 | #99 | Exceptional 12.2% |
| Immigrants | Australia | 97.1 /100 | #100 | Exceptional 12.2% |
| Immigrants | Latvia | 97.0 /100 | #101 | Exceptional 12.2% |