Black/African American vs Bahamian Child Poverty Among Girls Under 16
COMPARE
Black/African American
Bahamian
Child Poverty Among Girls Under 16
Child Poverty Among Girls Under 16 Comparison
Blacks/African Americans
Bahamians
24.7%
CHILD POVERTY AMONG GIRLS UNDER 16
0.0/ 100
METRIC RATING
333rd/ 347
METRIC RANK
21.5%
CHILD POVERTY AMONG GIRLS UNDER 16
0.0/ 100
METRIC RATING
309th/ 347
METRIC RANK
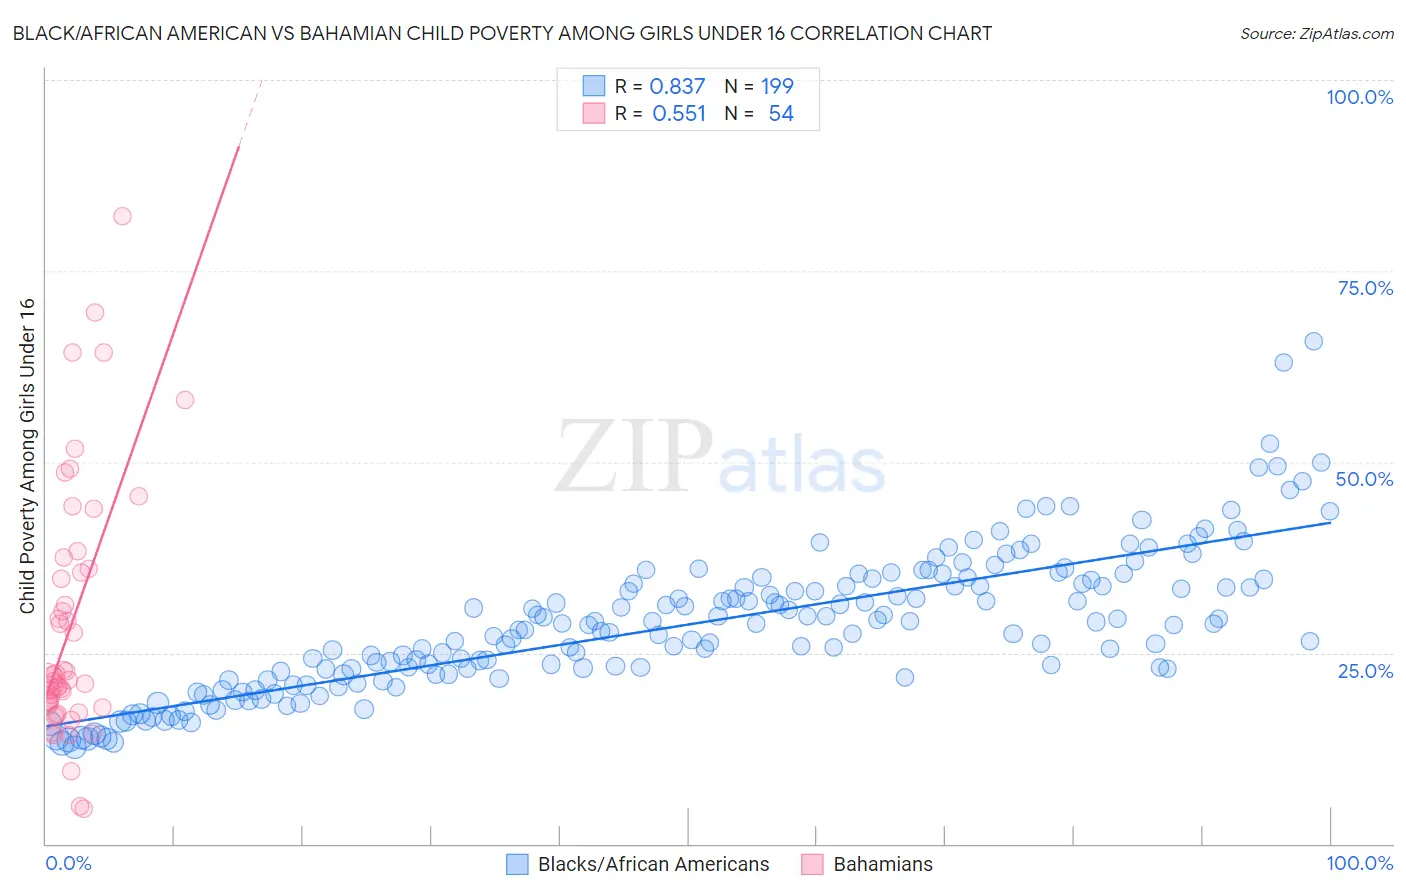
Black/African American vs Bahamian Child Poverty Among Girls Under 16 Correlation Chart
The statistical analysis conducted on geographies consisting of 546,554,396 people shows a very strong positive correlation between the proportion of Blacks/African Americans and poverty level among girls under the age of 16 in the United States with a correlation coefficient (R) of 0.837 and weighted average of 24.7%. Similarly, the statistical analysis conducted on geographies consisting of 112,230,228 people shows a substantial positive correlation between the proportion of Bahamians and poverty level among girls under the age of 16 in the United States with a correlation coefficient (R) of 0.551 and weighted average of 21.5%, a difference of 14.6%.
Child Poverty Among Girls Under 16 Correlation Summary
| Measurement | Black/African American | Bahamian |
| Minimum | 12.6% | 4.6% |
| Maximum | 65.8% | 82.1% |
| Range | 53.1% | 77.5% |
| Mean | 28.6% | 28.7% |
| Median | 28.6% | 21.4% |
| Interquartile 25% (IQ1) | 22.1% | 18.2% |
| Interquartile 75% (IQ3) | 34.0% | 36.0% |
| Interquartile Range (IQR) | 11.9% | 17.8% |
| Standard Deviation (Sample) | 9.2% | 16.7% |
| Standard Deviation (Population) | 9.2% | 16.5% |
Similar Demographics by Child Poverty Among Girls Under 16
Demographics Similar to Blacks/African Americans by Child Poverty Among Girls Under 16
In terms of child poverty among girls under 16, the demographic groups most similar to Blacks/African Americans are Menominee (25.0%, a difference of 1.5%), Pueblo (25.2%, a difference of 2.2%), Native/Alaskan (24.0%, a difference of 2.5%), Apache (23.8%, a difference of 3.4%), and Immigrants from Dominican Republic (23.8%, a difference of 3.5%).
| Demographics | Rating | Rank | Child Poverty Among Girls Under 16 |
| Immigrants | Honduras | 0.0 /100 | #326 | Tragic 22.8% |
| Central American Indians | 0.0 /100 | #327 | Tragic 22.8% |
| Dominicans | 0.0 /100 | #328 | Tragic 23.7% |
| Kiowa | 0.0 /100 | #329 | Tragic 23.7% |
| Immigrants | Dominican Republic | 0.0 /100 | #330 | Tragic 23.8% |
| Apache | 0.0 /100 | #331 | Tragic 23.8% |
| Natives/Alaskans | 0.0 /100 | #332 | Tragic 24.0% |
| Blacks/African Americans | 0.0 /100 | #333 | Tragic 24.7% |
| Menominee | 0.0 /100 | #334 | Tragic 25.0% |
| Pueblo | 0.0 /100 | #335 | Tragic 25.2% |
| Sioux | 0.0 /100 | #336 | Tragic 25.6% |
| Yup'ik | 0.0 /100 | #337 | Tragic 25.8% |
| Cheyenne | 0.0 /100 | #338 | Tragic 26.3% |
| Crow | 0.0 /100 | #339 | Tragic 26.4% |
| Yuman | 0.0 /100 | #340 | Tragic 27.1% |
Demographics Similar to Bahamians by Child Poverty Among Girls Under 16
In terms of child poverty among girls under 16, the demographic groups most similar to Bahamians are Houma (21.5%, a difference of 0.12%), Immigrants from Somalia (21.6%, a difference of 0.27%), Immigrants from Bahamas (21.4%, a difference of 0.30%), Immigrants from Central America (21.4%, a difference of 0.31%), and Dutch West Indian (21.6%, a difference of 0.33%).
| Demographics | Rating | Rank | Child Poverty Among Girls Under 16 |
| Seminole | 0.0 /100 | #302 | Tragic 21.2% |
| British West Indians | 0.0 /100 | #303 | Tragic 21.3% |
| Indonesians | 0.0 /100 | #304 | Tragic 21.3% |
| Guatemalans | 0.0 /100 | #305 | Tragic 21.4% |
| Immigrants | Central America | 0.0 /100 | #306 | Tragic 21.4% |
| Immigrants | Bahamas | 0.0 /100 | #307 | Tragic 21.4% |
| Houma | 0.0 /100 | #308 | Tragic 21.5% |
| Bahamians | 0.0 /100 | #309 | Tragic 21.5% |
| Immigrants | Somalia | 0.0 /100 | #310 | Tragic 21.6% |
| Dutch West Indians | 0.0 /100 | #311 | Tragic 21.6% |
| Immigrants | Mexico | 0.0 /100 | #312 | Tragic 21.6% |
| Creek | 0.0 /100 | #313 | Tragic 21.7% |
| Arapaho | 0.0 /100 | #314 | Tragic 21.7% |
| Ute | 0.0 /100 | #315 | Tragic 21.8% |
| Immigrants | Guatemala | 0.0 /100 | #316 | Tragic 21.9% |