Blackfeet vs Scottish Poverty
COMPARE
Blackfeet
Scottish
Poverty
Poverty Comparison
Blackfeet
Scottish
15.2%
POVERTY
0.0/ 100
METRIC RATING
294th/ 347
METRIC RANK
11.5%
POVERTY
94.0/ 100
METRIC RATING
100th/ 347
METRIC RANK
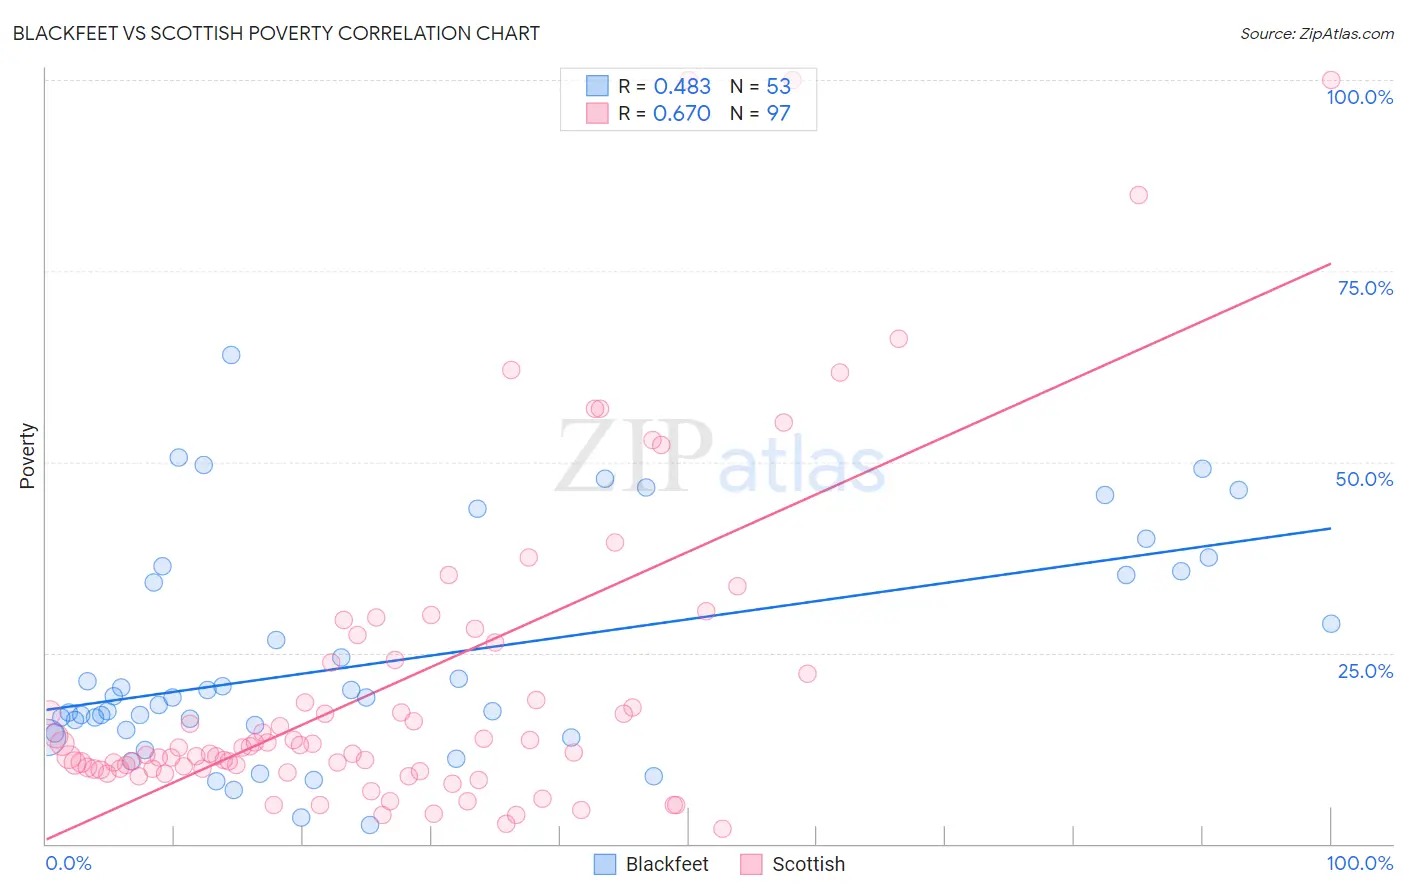
Blackfeet vs Scottish Poverty Correlation Chart
The statistical analysis conducted on geographies consisting of 309,474,623 people shows a moderate positive correlation between the proportion of Blackfeet and poverty level in the United States with a correlation coefficient (R) of 0.483 and weighted average of 15.2%. Similarly, the statistical analysis conducted on geographies consisting of 566,309,495 people shows a significant positive correlation between the proportion of Scottish and poverty level in the United States with a correlation coefficient (R) of 0.670 and weighted average of 11.5%, a difference of 32.2%.
Poverty Correlation Summary
| Measurement | Blackfeet | Scottish |
| Minimum | 2.5% | 1.9% |
| Maximum | 64.1% | 100.0% |
| Range | 61.6% | 98.1% |
| Mean | 23.9% | 20.9% |
| Median | 19.1% | 12.6% |
| Interquartile 25% (IQ1) | 14.7% | 9.8% |
| Interquartile 75% (IQ3) | 35.4% | 23.9% |
| Interquartile Range (IQR) | 20.7% | 14.1% |
| Standard Deviation (Sample) | 14.4% | 21.4% |
| Standard Deviation (Population) | 14.3% | 21.3% |
Similar Demographics by Poverty
Demographics Similar to Blackfeet by Poverty
In terms of poverty, the demographic groups most similar to Blackfeet are Guatemalan (15.3%, a difference of 0.42%), Hispanic or Latino (15.3%, a difference of 0.43%), Indonesian (15.1%, a difference of 0.44%), Immigrants from Zaire (15.1%, a difference of 0.44%), and Immigrants from Bangladesh (15.3%, a difference of 0.47%).
| Demographics | Rating | Rank | Poverty |
| Inupiat | 0.0 /100 | #287 | Tragic 15.1% |
| Yaqui | 0.0 /100 | #288 | Tragic 15.1% |
| Immigrants | Belize | 0.0 /100 | #289 | Tragic 15.1% |
| Mexicans | 0.0 /100 | #290 | Tragic 15.1% |
| Immigrants | Cabo Verde | 0.0 /100 | #291 | Tragic 15.1% |
| Indonesians | 0.0 /100 | #292 | Tragic 15.1% |
| Immigrants | Zaire | 0.0 /100 | #293 | Tragic 15.1% |
| Blackfeet | 0.0 /100 | #294 | Tragic 15.2% |
| Guatemalans | 0.0 /100 | #295 | Tragic 15.3% |
| Hispanics or Latinos | 0.0 /100 | #296 | Tragic 15.3% |
| Immigrants | Bangladesh | 0.0 /100 | #297 | Tragic 15.3% |
| Immigrants | Senegal | 0.0 /100 | #298 | Tragic 15.3% |
| Senegalese | 0.0 /100 | #299 | Tragic 15.3% |
| Immigrants | Central America | 0.0 /100 | #300 | Tragic 15.4% |
| Bahamians | 0.0 /100 | #301 | Tragic 15.4% |
Demographics Similar to Scottish by Poverty
In terms of poverty, the demographic groups most similar to Scottish are Immigrants from Indonesia (11.5%, a difference of 0.11%), Immigrants from Latvia (11.5%, a difference of 0.24%), Immigrants from Egypt (11.5%, a difference of 0.28%), Immigrants from South Africa (11.5%, a difference of 0.31%), and Slavic (11.5%, a difference of 0.31%).
| Demographics | Rating | Rank | Poverty |
| Romanians | 94.9 /100 | #93 | Exceptional 11.4% |
| Paraguayans | 94.9 /100 | #94 | Exceptional 11.4% |
| Australians | 94.9 /100 | #95 | Exceptional 11.4% |
| Immigrants | South Africa | 94.7 /100 | #96 | Exceptional 11.5% |
| Immigrants | Egypt | 94.6 /100 | #97 | Exceptional 11.5% |
| Immigrants | Latvia | 94.5 /100 | #98 | Exceptional 11.5% |
| Immigrants | Indonesia | 94.2 /100 | #99 | Exceptional 11.5% |
| Scottish | 94.0 /100 | #100 | Exceptional 11.5% |
| Slavs | 93.3 /100 | #101 | Exceptional 11.5% |
| Laotians | 92.4 /100 | #102 | Exceptional 11.6% |
| Okinawans | 92.4 /100 | #103 | Exceptional 11.6% |
| Native Hawaiians | 92.1 /100 | #104 | Exceptional 11.6% |
| Portuguese | 92.1 /100 | #105 | Exceptional 11.6% |
| Immigrants | Zimbabwe | 92.1 /100 | #106 | Exceptional 11.6% |
| Palestinians | 91.8 /100 | #107 | Exceptional 11.6% |