Blackfeet vs Mexican American Indian Female Poverty Among 18-24 Year Olds
COMPARE
Blackfeet
Mexican American Indian
Female Poverty Among 18-24 Year Olds
Female Poverty Among 18-24 Year Olds Comparison
Blackfeet
Mexican American Indians
23.6%
FEMALE POVERTY AMONG 18-24 YEAR OLDS
0.0/ 100
METRIC RATING
309th/ 347
METRIC RANK
20.4%
FEMALE POVERTY AMONG 18-24 YEAR OLDS
23.2/ 100
METRIC RATING
194th/ 347
METRIC RANK
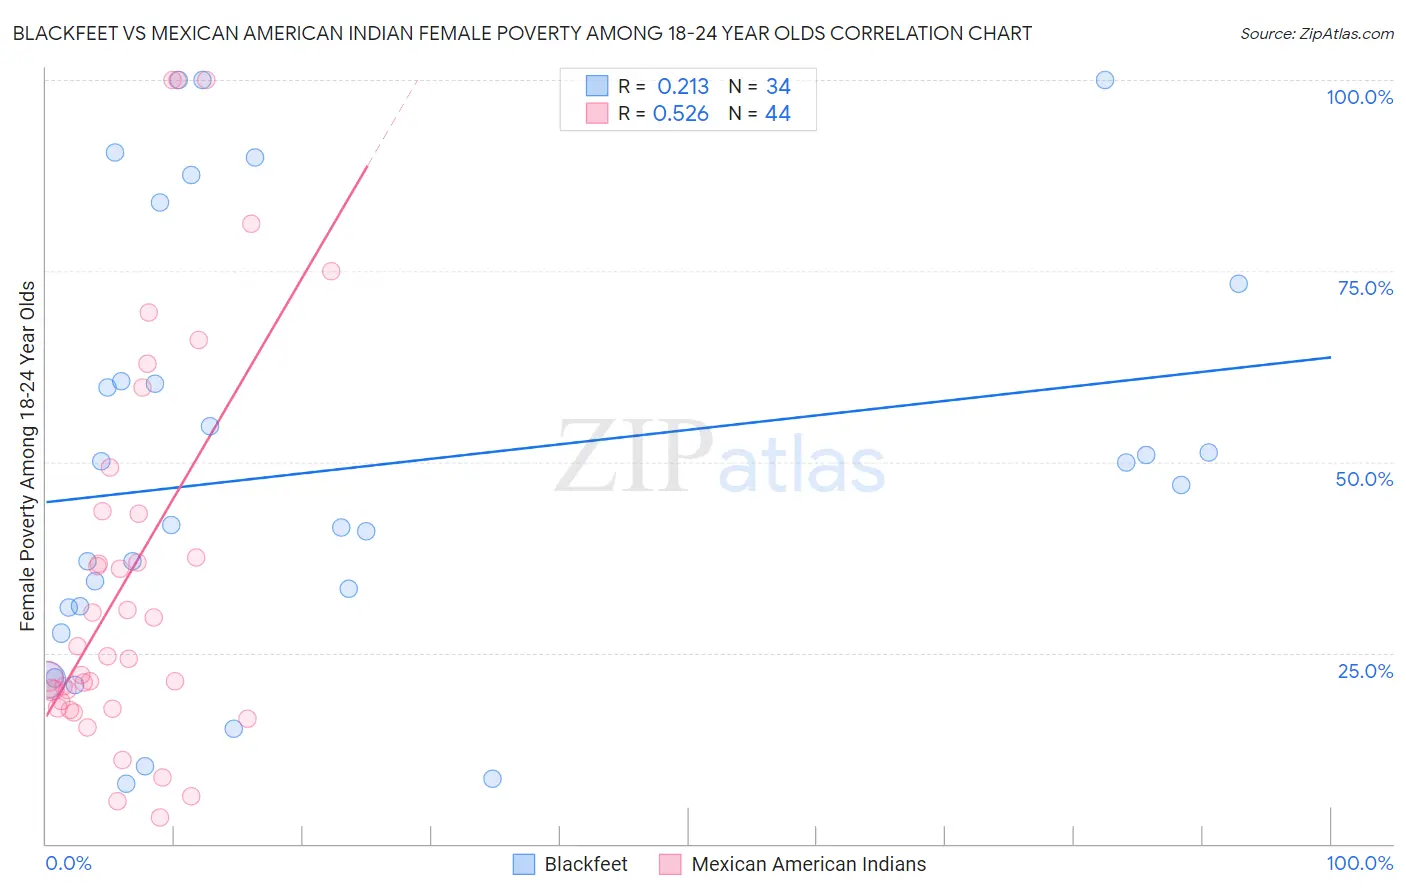
Blackfeet vs Mexican American Indian Female Poverty Among 18-24 Year Olds Correlation Chart
The statistical analysis conducted on geographies consisting of 304,376,728 people shows a weak positive correlation between the proportion of Blackfeet and poverty level among females between the ages 18 and 24 in the United States with a correlation coefficient (R) of 0.213 and weighted average of 23.6%. Similarly, the statistical analysis conducted on geographies consisting of 313,953,450 people shows a substantial positive correlation between the proportion of Mexican American Indians and poverty level among females between the ages 18 and 24 in the United States with a correlation coefficient (R) of 0.526 and weighted average of 20.4%, a difference of 15.8%.
Female Poverty Among 18-24 Year Olds Correlation Summary
| Measurement | Blackfeet | Mexican American Indian |
| Minimum | 7.9% | 3.4% |
| Maximum | 100.0% | 100.0% |
| Range | 92.1% | 96.6% |
| Mean | 49.1% | 35.1% |
| Median | 44.4% | 24.4% |
| Interquartile 25% (IQ1) | 31.0% | 18.3% |
| Interquartile 75% (IQ3) | 60.5% | 43.4% |
| Interquartile Range (IQR) | 29.5% | 25.2% |
| Standard Deviation (Sample) | 27.7% | 25.8% |
| Standard Deviation (Population) | 27.2% | 25.5% |
Similar Demographics by Female Poverty Among 18-24 Year Olds
Demographics Similar to Blackfeet by Female Poverty Among 18-24 Year Olds
In terms of female poverty among 18-24 year olds, the demographic groups most similar to Blackfeet are Comanche (23.6%, a difference of 0.050%), Potawatomi (23.7%, a difference of 0.34%), Immigrants from Sudan (23.5%, a difference of 0.45%), Cree (23.4%, a difference of 0.80%), and Paiute (23.3%, a difference of 1.4%).
| Demographics | Rating | Rank | Female Poverty Among 18-24 Year Olds |
| Iroquois | 0.0 /100 | #302 | Tragic 22.9% |
| Senegalese | 0.0 /100 | #303 | Tragic 23.0% |
| Sudanese | 0.0 /100 | #304 | Tragic 23.0% |
| Immigrants | Kuwait | 0.0 /100 | #305 | Tragic 23.0% |
| Paiute | 0.0 /100 | #306 | Tragic 23.3% |
| Cree | 0.0 /100 | #307 | Tragic 23.4% |
| Immigrants | Sudan | 0.0 /100 | #308 | Tragic 23.5% |
| Blackfeet | 0.0 /100 | #309 | Tragic 23.6% |
| Comanche | 0.0 /100 | #310 | Tragic 23.6% |
| Potawatomi | 0.0 /100 | #311 | Tragic 23.7% |
| Yuman | 0.0 /100 | #312 | Tragic 24.0% |
| Creek | 0.0 /100 | #313 | Tragic 24.2% |
| Choctaw | 0.0 /100 | #314 | Tragic 24.3% |
| Blacks/African Americans | 0.0 /100 | #315 | Tragic 24.3% |
| Alsatians | 0.0 /100 | #316 | Tragic 24.4% |
Demographics Similar to Mexican American Indians by Female Poverty Among 18-24 Year Olds
In terms of female poverty among 18-24 year olds, the demographic groups most similar to Mexican American Indians are Nigerian (20.4%, a difference of 0.010%), Immigrants from Latvia (20.4%, a difference of 0.010%), Czech (20.4%, a difference of 0.060%), Immigrants from Israel (20.4%, a difference of 0.080%), and Zimbabwean (20.4%, a difference of 0.15%).
| Demographics | Rating | Rank | Female Poverty Among 18-24 Year Olds |
| Immigrants | Mexico | 36.3 /100 | #187 | Fair 20.2% |
| Scandinavians | 34.6 /100 | #188 | Fair 20.3% |
| Immigrants | Germany | 34.0 /100 | #189 | Fair 20.3% |
| Immigrants | Western Asia | 29.3 /100 | #190 | Fair 20.3% |
| Moroccans | 25.8 /100 | #191 | Fair 20.4% |
| Immigrants | Israel | 24.4 /100 | #192 | Fair 20.4% |
| Nigerians | 23.4 /100 | #193 | Fair 20.4% |
| Mexican American Indians | 23.2 /100 | #194 | Fair 20.4% |
| Immigrants | Latvia | 23.0 /100 | #195 | Fair 20.4% |
| Czechs | 22.3 /100 | #196 | Fair 20.4% |
| Zimbabweans | 21.0 /100 | #197 | Fair 20.4% |
| Immigrants | Spain | 20.7 /100 | #198 | Fair 20.4% |
| Germans | 20.6 /100 | #199 | Fair 20.4% |
| Europeans | 19.9 /100 | #200 | Poor 20.4% |
| Mexicans | 18.3 /100 | #201 | Poor 20.5% |