Bhutanese vs Black/African American Female Poverty

COMPARE

Bhutanese
Race
Ancestry
AfghanAfricanAlaska NativeAlaskan AthabascanAlbanianAleutAlsatianAmericanApacheArabArapahoArgentineanArmenianAssyrian/Chaldean/SyriacAustralianAustrianBahamianBangladeshiBarbadianBasqueBelgianBelizeanBermudanBhutaneseBlackfeetBolivianBrazilianBritishBritish West IndianBulgarianBurmeseCajunCambodianCanadianCape VerdeanCarpatho RusynCelticCentral AmericanCentral American IndianCherokeeCheyenneChickasawChileanChineseChippewaChoctawColombianColvilleComancheCosta RicanCreeCreekCroatianCrowCubanCypriotCzechCzechoslovakianDanishDelawareDominicanDutchDutch West IndianEastern EuropeanEcuadorianEgyptianEnglishEstonianEthiopianEuropeanFijianFilipinoFinnishFrenchFrench American IndianFrench CanadianGermanGerman RussianGhanaianGreekGuamanian/ChamorroGuatemalanGuyaneseHaitianHmongHonduranHopiHoumaHungarianIcelanderIndian (Asian)IndonesianInupiatIranianIraqiIrishIroquoisIsraeliItalianJamaicanJapaneseJordanianKenyanKiowaKoreanLaotianLatvianLebaneseLiberianLithuanianLumbeeLuxembourgerMacedonianMalaysianMalteseMarshalleseMenomineeMexicanMexican American IndianMongolianMoroccanNative HawaiianNavajoNepaleseNew ZealanderNicaraguanNigerianNorthern EuropeanNorwegianOkinawanOsageOttawaPaiutePakistaniPalestinianPanamanianParaguayanPennsylvania GermanPeruvianPimaPolishPortuguesePotawatomiPuebloPuerto RicanPuget Sound SalishRomanianRussianSalvadoranSamoanScandinavianScotch-IrishScottishSeminoleSenegaleseSerbianShoshoneSierra LeoneanSiouxSlavicSlovakSloveneSomaliSouth AfricanSouth AmericanSouth American IndianSoviet UnionSpaniardSpanishSpanish AmericanSpanish American IndianSri LankanSubsaharan AfricanSudaneseSwedishSwissSyrianTaiwaneseThaiTlingit-HaidaTohono O'OdhamTonganTrinidadian and TobagonianTsimshianTurkishU.S. Virgin IslanderUgandanUkrainianUruguayanUteVenezuelanVietnameseWelshWest IndianYakamaYaquiYugoslavianYumanYup'ikZimbabwean
Immigration
NonimmigrantsImmigrantsAfghanistanAfricaAlbaniaArgentinaArmeniaAsiaAustraliaAustriaBahamasBangladeshBarbadosBelarusBelgiumBelizeBoliviaBosnia and HerzegovinaBrazilBulgariaBurma/MyanmarCabo VerdeCambodiaCameroonCanadaCaribbeanCentral AmericaChileChinaColombiaCongoCosta RicaCroatiaCubaCzechoslovakiaDenmarkDominicaDominican RepublicEastern AfricaEastern AsiaEastern EuropeEcuadorEgyptEl SalvadorEnglandEritreaEthiopiaEuropeFijiFranceGermanyGhanaGreeceGrenadaGuatemalaGuyanaHaitiHondurasHong KongHungaryIndiaIndonesiaIranIraqIrelandIsraelItalyJamaicaJapanJordanKazakhstanKenyaKoreaKuwaitLaosLatin AmericaLatviaLebanonLiberiaLithuaniaMalaysiaMexicoMicronesiaMiddle AfricaMoldovaMoroccoNepalNetherlandsNicaraguaNigeriaNorth AmericaNorth MacedoniaNorthern AfricaNorthern EuropeNorwayOceaniaPakistanPanamaPeruPhilippinesPolandPortugalRomaniaRussiaSaudi ArabiaScotlandSenegalSerbiaSierra LeoneSingaporeSomaliaSouth AfricaSouth AmericaSouth Central AsiaSouth Eastern AsiaSouthern EuropeSpainSri LankaSt. Vincent and the GrenadinesSudanSwedenSwitzerlandSyriaTaiwanThailandTrinidad and TobagoTurkeyUgandaUkraineUruguayUzbekistanVenezuelaVietnamWest IndiesWestern AfricaWestern AsiaWestern EuropeYemenZaireZimbabweAzores
Black/African American
Race
Ancestry
AfghanAfricanAlaska NativeAlaskan AthabascanAlbanianAleutAlsatianAmericanApacheArabArapahoArgentineanArmenianAssyrian/Chaldean/SyriacAustralianAustrianBahamianBangladeshiBarbadianBasqueBelgianBelizeanBermudanBlackfeetBolivianBrazilianBritishBritish West IndianBulgarianBurmeseCajunCambodianCanadianCape VerdeanCarpatho RusynCelticCentral AmericanCentral American IndianCherokeeCheyenneChickasawChileanChineseChippewaChoctawColombianColvilleComancheCosta RicanCreeCreekCroatianCrowCubanCypriotCzechCzechoslovakianDanishDelawareDominicanDutchDutch West IndianEastern EuropeanEcuadorianEgyptianEnglishEstonianEthiopianEuropeanFijianFilipinoFinnishFrenchFrench American IndianFrench CanadianGermanGerman RussianGhanaianGreekGuamanian/ChamorroGuatemalanGuyaneseHaitianHmongHonduranHopiHoumaHungarianIcelanderIndian (Asian)IndonesianInupiatIranianIraqiIrishIroquoisIsraeliItalianJamaicanJapaneseJordanianKenyanKiowaKoreanLaotianLatvianLebaneseLiberianLithuanianLumbeeLuxembourgerMacedonianMalaysianMalteseMarshalleseMenomineeMexicanMexican American IndianMongolianMoroccanNative HawaiianNavajoNepaleseNew ZealanderNicaraguanNigerianNorthern EuropeanNorwegianOkinawanOsageOttawaPaiutePakistaniPalestinianPanamanianParaguayanPennsylvania GermanPeruvianPimaPolishPortuguesePotawatomiPuebloPuerto RicanPuget Sound SalishRomanianRussianSalvadoranSamoanScandinavianScotch-IrishScottishSeminoleSenegaleseSerbianShoshoneSierra LeoneanSiouxSlavicSlovakSloveneSomaliSouth AfricanSouth AmericanSouth American IndianSoviet UnionSpaniardSpanishSpanish AmericanSpanish American IndianSri LankanSubsaharan AfricanSudaneseSwedishSwissSyrianTaiwaneseThaiTlingit-HaidaTohono O'OdhamTonganTrinidadian and TobagonianTsimshianTurkishU.S. Virgin IslanderUgandanUkrainianUruguayanUteVenezuelanVietnameseWelshWest IndianYakamaYaquiYugoslavianYumanYup'ikZimbabwean
Immigration
NonimmigrantsImmigrantsAfghanistanAfricaAlbaniaArgentinaArmeniaAsiaAustraliaAustriaBahamasBangladeshBarbadosBelarusBelgiumBelizeBoliviaBosnia and HerzegovinaBrazilBulgariaBurma/MyanmarCabo VerdeCambodiaCameroonCanadaCaribbeanCentral AmericaChileChinaColombiaCongoCosta RicaCroatiaCubaCzechoslovakiaDenmarkDominicaDominican RepublicEastern AfricaEastern AsiaEastern EuropeEcuadorEgyptEl SalvadorEnglandEritreaEthiopiaEuropeFijiFranceGermanyGhanaGreeceGrenadaGuatemalaGuyanaHaitiHondurasHong KongHungaryIndiaIndonesiaIranIraqIrelandIsraelItalyJamaicaJapanJordanKazakhstanKenyaKoreaKuwaitLaosLatin AmericaLatviaLebanonLiberiaLithuaniaMalaysiaMexicoMicronesiaMiddle AfricaMoldovaMoroccoNepalNetherlandsNicaraguaNigeriaNorth AmericaNorth MacedoniaNorthern AfricaNorthern EuropeNorwayOceaniaPakistanPanamaPeruPhilippinesPolandPortugalRomaniaRussiaSaudi ArabiaScotlandSenegalSerbiaSierra LeoneSingaporeSomaliaSouth AfricaSouth AmericaSouth Central AsiaSouth Eastern AsiaSouthern EuropeSpainSri LankaSt. Vincent and the GrenadinesSudanSwedenSwitzerlandSyriaTaiwanThailandTrinidad and TobagoTurkeyUgandaUkraineUruguayUzbekistanVenezuelaVietnamWest IndiesWestern AfricaWestern AsiaWestern EuropeYemenZaireZimbabweAzores
Female Poverty
Income
Poverty
Unemployment
Labor Participation
Family Structure
Vehicle Availability
Education Level
Disability

Female Poverty Comparison

Bhutanese

Blacks/African Americans

Exceptional
Tragic
11.3%
FEMALE POVERTY
99.9/ 100
METRIC RATING
12th/ 347
METRIC RANK
18.6%
FEMALE POVERTY
0.0/ 100
METRIC RATING
328th/ 347
METRIC RANK

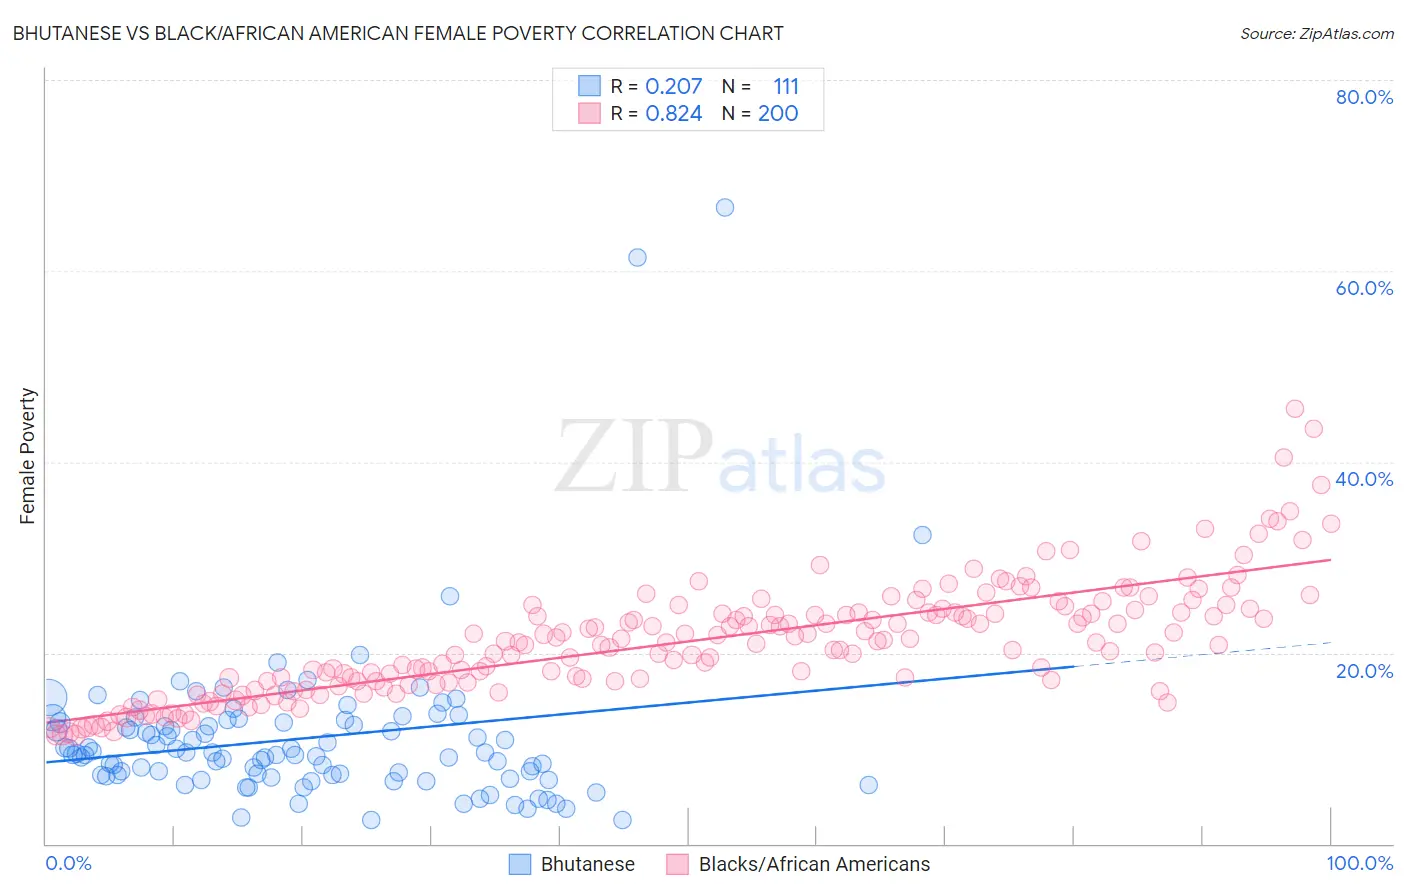
Bhutanese vs Black/African American Female Poverty Correlation Chart

The statistical analysis conducted on geographies consisting of 455,052,143 people shows a weak positive correlation between the proportion of Bhutanese and poverty level among females in the United States with a correlation coefficient (R) of 0.207 and weighted average of 11.3%. Similarly, the statistical analysis conducted on geographies consisting of 564,914,608 people shows a very strong positive correlation between the proportion of Blacks/African Americans and poverty level among females in the United States with a correlation coefficient (R) of 0.824 and weighted average of 18.6%, a difference of 64.7%.
Bhutanese vs Black/African American Female Poverty

Female Poverty Correlation Summary

MeasurementBhutaneseBlack/African American
Minimum2.5%11.4%
Maximum66.7%45.5%
Range64.2%34.1%
Mean11.1%21.2%
Median9.4%21.0%
Interquartile 25% (IQ1)7.2%16.9%
Interquartile 75% (IQ3)12.7%24.2%
Interquartile Range (IQR)5.6%7.3%
Standard Deviation (Sample)8.5%6.0%
Standard Deviation (Population)8.5%6.0%

Similar Demographics by Female Poverty

Demographics Similar to Bhutanese by Female Poverty

In terms of female poverty, the demographic groups most similar to Bhutanese are Immigrants from Lithuania (11.3%, a difference of 0.010%), Maltese (11.2%, a difference of 0.46%), Immigrants from Hong Kong (11.2%, a difference of 0.57%), Lithuanian (11.4%, a difference of 0.97%), and Latvian (11.4%, a difference of 1.3%).
DemographicsRating | RankFemale Poverty
Filipinos
100.0
/100
|
#5
Exceptional
10.9%
Immigrants | Ireland
99.9
/100
|
#6
Exceptional
11.0%
Assyrians/Chaldeans/Syriacs
99.9
/100
|
#7
Exceptional
11.0%
Immigrants | South Central Asia
99.9
/100
|
#8
Exceptional
11.1%
Bulgarians
99.9
/100
|
#9
Exceptional
11.1%
Immigrants | Hong Kong
99.9
/100
|
#10
Exceptional
11.2%
Maltese
99.9
/100
|
#11
Exceptional
11.2%
Bhutanese
99.9
/100
|
#12
Exceptional
11.3%
Immigrants | Lithuania
99.9
/100
|
#13
Exceptional
11.3%
Lithuanians
99.8
/100
|
#14
Exceptional
11.4%
Latvians
99.8
/100
|
#15
Exceptional
11.4%
Immigrants | Bolivia
99.8
/100
|
#16
Exceptional
11.5%
Bolivians
99.8
/100
|
#17
Exceptional
11.5%
Immigrants | Scotland
99.8
/100
|
#18
Exceptional
11.5%
Norwegians
99.8
/100
|
#19
Exceptional
11.5%

Demographics Similar to Blacks/African Americans by Female Poverty

In terms of female poverty, the demographic groups most similar to Blacks/African Americans are Kiowa (18.6%, a difference of 0.12%), Dominican (19.1%, a difference of 2.9%), Yakama (18.0%, a difference of 3.0%), Central American Indian (18.0%, a difference of 3.1%), and Native/Alaskan (19.2%, a difference of 3.3%).
DemographicsRating | RankFemale Poverty
Arapaho
0.0
/100
|
#321
Tragic
17.5%
Menominee
0.0
/100
|
#322
Tragic
17.6%
Paiute
0.0
/100
|
#323
Tragic
17.7%
Immigrants | Honduras
0.0
/100
|
#324
Tragic
17.7%
Colville
0.0
/100
|
#325
Tragic
17.8%
Central American Indians
0.0
/100
|
#326
Tragic
18.0%
Yakama
0.0
/100
|
#327
Tragic
18.0%
Blacks/African Americans
0.0
/100
|
#328
Tragic
18.6%
Kiowa
0.0
/100
|
#329
Tragic
18.6%
Dominicans
0.0
/100
|
#330
Tragic
19.1%
Natives/Alaskans
0.0
/100
|
#331
Tragic
19.2%
Apache
0.0
/100
|
#332
Tragic
19.2%
Immigrants | Dominican Republic
0.0
/100
|
#333
Tragic
19.3%
Houma
0.0
/100
|
#334
Tragic
20.0%
Cheyenne
0.0
/100
|
#335
Tragic
20.2%