Bermudan vs Navajo Female Poverty Among 18-24 Year Olds
COMPARE
Bermudan
Navajo
Female Poverty Among 18-24 Year Olds
Female Poverty Among 18-24 Year Olds Comparison
Bermudans
Navajo
21.9%
FEMALE POVERTY AMONG 18-24 YEAR OLDS
0.1/ 100
METRIC RATING
282nd/ 347
METRIC RANK
30.3%
FEMALE POVERTY AMONG 18-24 YEAR OLDS
0.0/ 100
METRIC RATING
344th/ 347
METRIC RANK
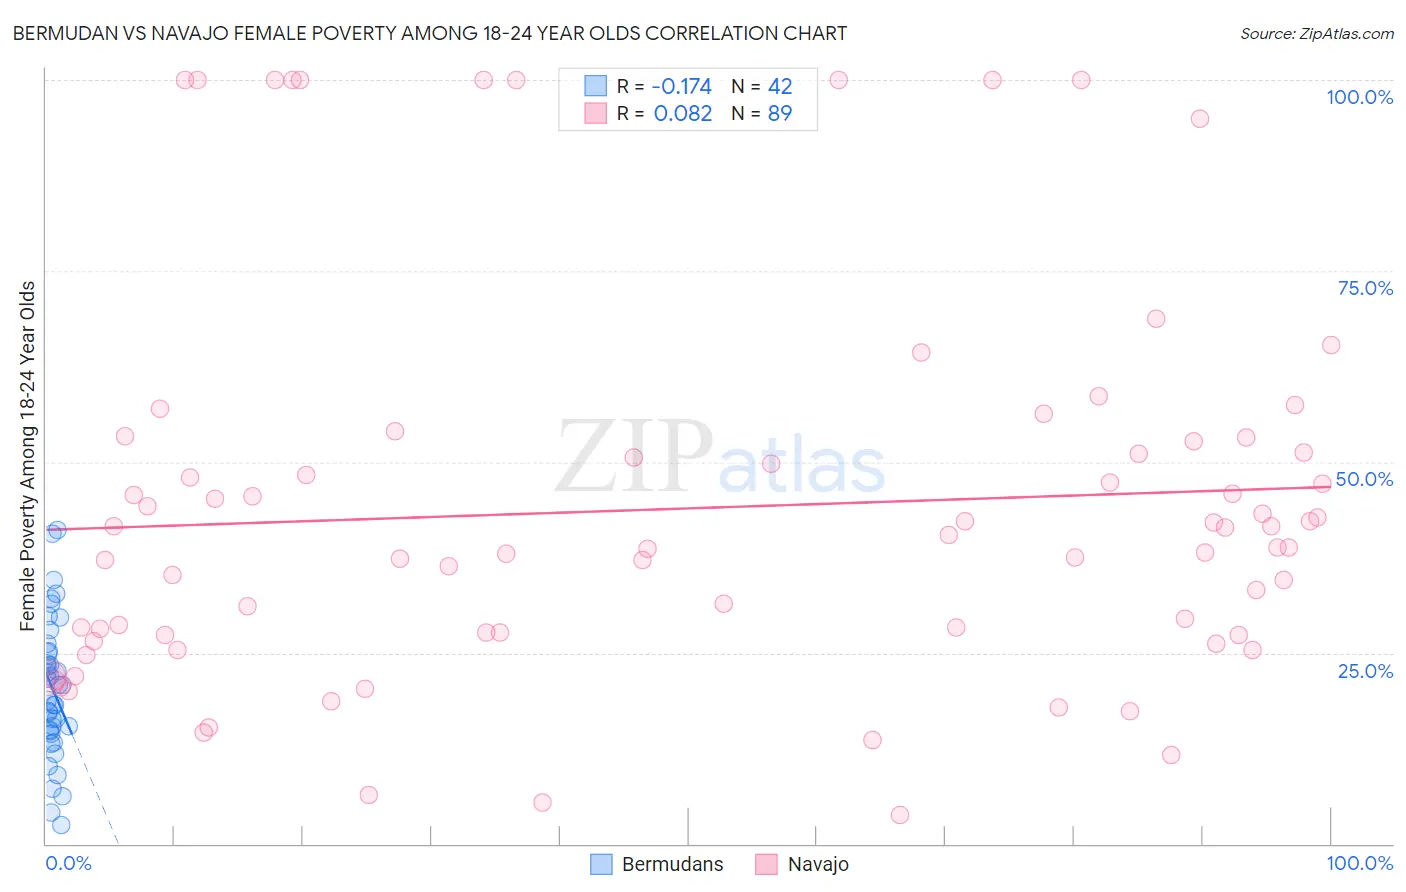
Bermudan vs Navajo Female Poverty Among 18-24 Year Olds Correlation Chart
The statistical analysis conducted on geographies consisting of 55,519,020 people shows a poor negative correlation between the proportion of Bermudans and poverty level among females between the ages 18 and 24 in the United States with a correlation coefficient (R) of -0.174 and weighted average of 21.9%. Similarly, the statistical analysis conducted on geographies consisting of 222,181,073 people shows a slight positive correlation between the proportion of Navajo and poverty level among females between the ages 18 and 24 in the United States with a correlation coefficient (R) of 0.082 and weighted average of 30.3%, a difference of 38.1%.
Female Poverty Among 18-24 Year Olds Correlation Summary
| Measurement | Bermudan | Navajo |
| Minimum | 2.4% | 3.8% |
| Maximum | 41.1% | 100.0% |
| Range | 38.7% | 96.2% |
| Mean | 20.3% | 43.9% |
| Median | 19.8% | 38.8% |
| Interquartile 25% (IQ1) | 14.7% | 27.4% |
| Interquartile 75% (IQ3) | 25.1% | 52.0% |
| Interquartile Range (IQR) | 10.4% | 24.6% |
| Standard Deviation (Sample) | 9.1% | 25.0% |
| Standard Deviation (Population) | 9.0% | 24.9% |
Similar Demographics by Female Poverty Among 18-24 Year Olds
Demographics Similar to Bermudans by Female Poverty Among 18-24 Year Olds
In terms of female poverty among 18-24 year olds, the demographic groups most similar to Bermudans are Immigrants from Dominican Republic (21.9%, a difference of 0.090%), Immigrants from Dominica (21.9%, a difference of 0.13%), Spanish American (21.9%, a difference of 0.14%), Subsaharan African (22.0%, a difference of 0.30%), and Yaqui (21.9%, a difference of 0.31%).
| Demographics | Rating | Rank | Female Poverty Among 18-24 Year Olds |
| Immigrants | Bangladesh | 0.1 /100 | #275 | Tragic 21.8% |
| Bahamians | 0.1 /100 | #276 | Tragic 21.8% |
| Immigrants | Switzerland | 0.1 /100 | #277 | Tragic 21.8% |
| Yaqui | 0.1 /100 | #278 | Tragic 21.9% |
| Spanish Americans | 0.1 /100 | #279 | Tragic 21.9% |
| Immigrants | Dominica | 0.1 /100 | #280 | Tragic 21.9% |
| Immigrants | Dominican Republic | 0.1 /100 | #281 | Tragic 21.9% |
| Bermudans | 0.1 /100 | #282 | Tragic 21.9% |
| Sub-Saharan Africans | 0.0 /100 | #283 | Tragic 22.0% |
| Tlingit-Haida | 0.0 /100 | #284 | Tragic 22.0% |
| Ottawa | 0.0 /100 | #285 | Tragic 22.0% |
| Ugandans | 0.0 /100 | #286 | Tragic 22.1% |
| Immigrants | Middle Africa | 0.0 /100 | #287 | Tragic 22.1% |
| Dominicans | 0.0 /100 | #288 | Tragic 22.3% |
| French American Indians | 0.0 /100 | #289 | Tragic 22.3% |
Demographics Similar to Navajo by Female Poverty Among 18-24 Year Olds
In terms of female poverty among 18-24 year olds, the demographic groups most similar to Navajo are Puerto Rican (29.8%, a difference of 1.6%), Tohono O'odham (31.0%, a difference of 2.3%), Lumbee (31.1%, a difference of 2.5%), Kiowa (29.2%, a difference of 3.7%), and Colville (29.0%, a difference of 4.4%).
| Demographics | Rating | Rank | Female Poverty Among 18-24 Year Olds |
| Apache | 0.0 /100 | #333 | Tragic 26.3% |
| Pueblo | 0.0 /100 | #334 | Tragic 26.9% |
| Yup'ik | 0.0 /100 | #335 | Tragic 27.0% |
| Immigrants | Yemen | 0.0 /100 | #336 | Tragic 27.5% |
| Cheyenne | 0.0 /100 | #337 | Tragic 28.1% |
| Hopi | 0.0 /100 | #338 | Tragic 28.2% |
| Pima | 0.0 /100 | #339 | Tragic 28.4% |
| Sioux | 0.0 /100 | #340 | Tragic 28.6% |
| Colville | 0.0 /100 | #341 | Tragic 29.0% |
| Kiowa | 0.0 /100 | #342 | Tragic 29.2% |
| Puerto Ricans | 0.0 /100 | #343 | Tragic 29.8% |
| Navajo | 0.0 /100 | #344 | Tragic 30.3% |
| Tohono O'odham | 0.0 /100 | #345 | Tragic 31.0% |
| Lumbee | 0.0 /100 | #346 | Tragic 31.1% |
| Crow | 0.0 /100 | #347 | Tragic 33.2% |