Bermudan vs Croatian Child Poverty Under the Age of 16
COMPARE
Bermudan
Croatian
Child Poverty Under the Age of 16
Child Poverty Under the Age of 16 Comparison
Bermudans
Croatians
18.0%
CHILD POVERTY UNDER THE AGE OF 16
2.6/ 100
METRIC RATING
226th/ 347
METRIC RANK
13.8%
CHILD POVERTY UNDER THE AGE OF 16
99.4/ 100
METRIC RATING
41st/ 347
METRIC RANK
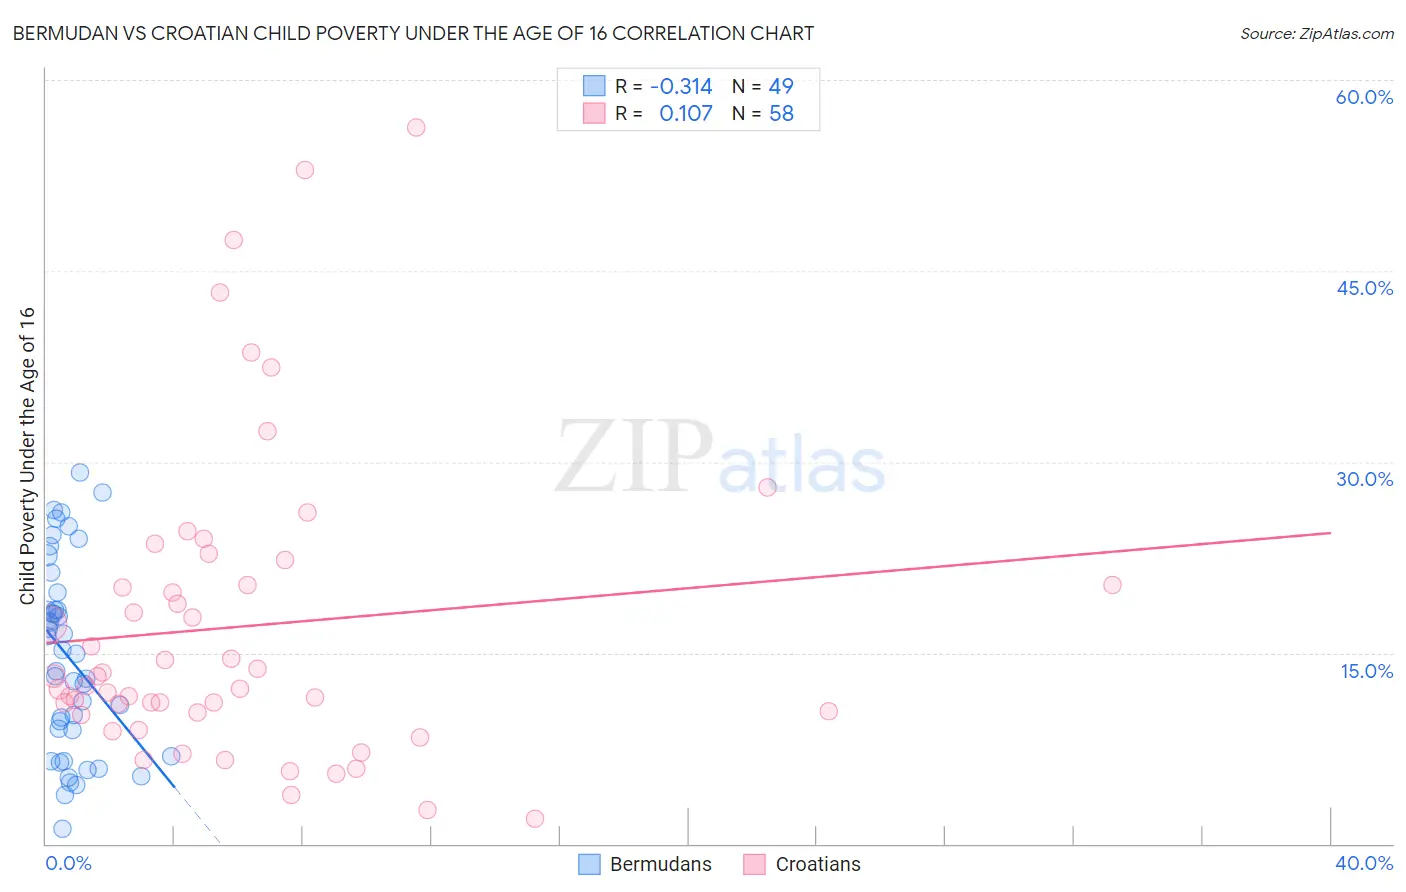
Bermudan vs Croatian Child Poverty Under the Age of 16 Correlation Chart
The statistical analysis conducted on geographies consisting of 55,690,108 people shows a mild negative correlation between the proportion of Bermudans and poverty level among children under the age of 16 in the United States with a correlation coefficient (R) of -0.314 and weighted average of 18.0%. Similarly, the statistical analysis conducted on geographies consisting of 371,525,585 people shows a poor positive correlation between the proportion of Croatians and poverty level among children under the age of 16 in the United States with a correlation coefficient (R) of 0.107 and weighted average of 13.8%, a difference of 30.6%.
Child Poverty Under the Age of 16 Correlation Summary
| Measurement | Bermudan | Croatian |
| Minimum | 1.2% | 2.0% |
| Maximum | 29.2% | 56.2% |
| Range | 28.0% | 54.3% |
| Mean | 14.6% | 17.1% |
| Median | 14.9% | 12.8% |
| Interquartile 25% (IQ1) | 7.9% | 10.3% |
| Interquartile 75% (IQ3) | 19.1% | 20.3% |
| Interquartile Range (IQR) | 11.1% | 10.0% |
| Standard Deviation (Sample) | 7.4% | 12.0% |
| Standard Deviation (Population) | 7.3% | 11.9% |
Similar Demographics by Child Poverty Under the Age of 16
Demographics Similar to Bermudans by Child Poverty Under the Age of 16
In terms of child poverty under the age of 16, the demographic groups most similar to Bermudans are Nonimmigrants (17.9%, a difference of 0.070%), Immigrants from Africa (18.0%, a difference of 0.18%), Immigrants from Micronesia (18.0%, a difference of 0.34%), Osage (17.9%, a difference of 0.43%), and Immigrants from Cambodia (17.8%, a difference of 0.67%).
| Demographics | Rating | Rank | Child Poverty Under the Age of 16 |
| Japanese | 4.7 /100 | #219 | Tragic 17.7% |
| Immigrants | Panama | 4.1 /100 | #220 | Tragic 17.7% |
| Cubans | 3.7 /100 | #221 | Tragic 17.8% |
| Immigrants | Armenia | 3.6 /100 | #222 | Tragic 17.8% |
| Immigrants | Cambodia | 3.3 /100 | #223 | Tragic 17.8% |
| Osage | 3.1 /100 | #224 | Tragic 17.9% |
| Immigrants | Nonimmigrants | 2.7 /100 | #225 | Tragic 17.9% |
| Bermudans | 2.6 /100 | #226 | Tragic 18.0% |
| Immigrants | Africa | 2.5 /100 | #227 | Tragic 18.0% |
| Immigrants | Micronesia | 2.3 /100 | #228 | Tragic 18.0% |
| Marshallese | 1.8 /100 | #229 | Tragic 18.1% |
| Nepalese | 1.7 /100 | #230 | Tragic 18.2% |
| Nicaraguans | 1.7 /100 | #231 | Tragic 18.2% |
| Americans | 1.2 /100 | #232 | Tragic 18.3% |
| Fijians | 1.1 /100 | #233 | Tragic 18.4% |
Demographics Similar to Croatians by Child Poverty Under the Age of 16
In terms of child poverty under the age of 16, the demographic groups most similar to Croatians are Immigrants from Sri Lanka (13.8%, a difference of 0.080%), Immigrants from Moldova (13.8%, a difference of 0.14%), Immigrants from Scotland (13.7%, a difference of 0.16%), Greek (13.8%, a difference of 0.31%), and Czech (13.8%, a difference of 0.37%).
| Demographics | Rating | Rank | Child Poverty Under the Age of 16 |
| Russians | 99.6 /100 | #34 | Exceptional 13.5% |
| Lithuanians | 99.6 /100 | #35 | Exceptional 13.5% |
| Immigrants | Northern Europe | 99.6 /100 | #36 | Exceptional 13.6% |
| Immigrants | Bolivia | 99.6 /100 | #37 | Exceptional 13.6% |
| Luxembourgers | 99.5 /100 | #38 | Exceptional 13.6% |
| Immigrants | Australia | 99.5 /100 | #39 | Exceptional 13.6% |
| Immigrants | Scotland | 99.4 /100 | #40 | Exceptional 13.7% |
| Croatians | 99.4 /100 | #41 | Exceptional 13.8% |
| Immigrants | Sri Lanka | 99.3 /100 | #42 | Exceptional 13.8% |
| Immigrants | Moldova | 99.3 /100 | #43 | Exceptional 13.8% |
| Greeks | 99.3 /100 | #44 | Exceptional 13.8% |
| Czechs | 99.3 /100 | #45 | Exceptional 13.8% |
| Immigrants | Asia | 99.2 /100 | #46 | Exceptional 13.8% |
| Estonians | 99.2 /100 | #47 | Exceptional 13.9% |
| Koreans | 99.2 /100 | #48 | Exceptional 13.9% |