Belizean vs Estonian Female Poverty
COMPARE
Belizean
Estonian
Female Poverty
Female Poverty Comparison
Belizeans
Estonians
15.9%
FEMALE POVERTY
0.0/ 100
METRIC RATING
272nd/ 347
METRIC RANK
12.1%
FEMALE POVERTY
98.3/ 100
METRIC RATING
56th/ 347
METRIC RANK
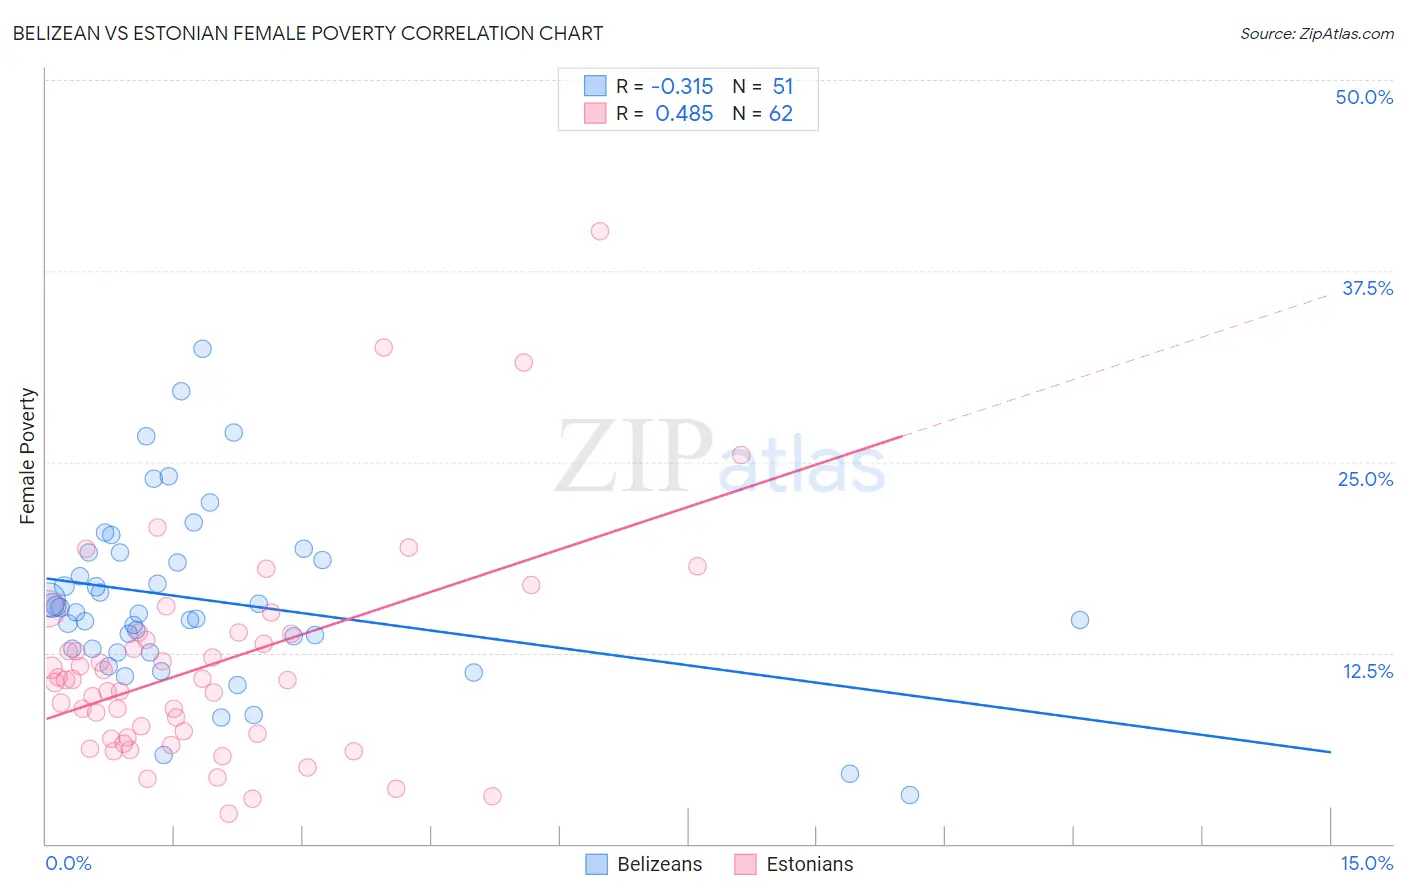
Belizean vs Estonian Female Poverty Correlation Chart
The statistical analysis conducted on geographies consisting of 144,152,301 people shows a mild negative correlation between the proportion of Belizeans and poverty level among females in the United States with a correlation coefficient (R) of -0.315 and weighted average of 15.9%. Similarly, the statistical analysis conducted on geographies consisting of 123,486,564 people shows a moderate positive correlation between the proportion of Estonians and poverty level among females in the United States with a correlation coefficient (R) of 0.485 and weighted average of 12.1%, a difference of 31.5%.
Female Poverty Correlation Summary
| Measurement | Belizean | Estonian |
| Minimum | 3.2% | 1.9% |
| Maximum | 32.4% | 40.1% |
| Range | 29.2% | 38.2% |
| Mean | 16.0% | 11.7% |
| Median | 15.2% | 10.7% |
| Interquartile 25% (IQ1) | 12.8% | 7.0% |
| Interquartile 75% (IQ3) | 19.1% | 13.8% |
| Interquartile Range (IQR) | 6.3% | 6.8% |
| Standard Deviation (Sample) | 5.8% | 7.1% |
| Standard Deviation (Population) | 5.8% | 7.0% |
Similar Demographics by Female Poverty
Demographics Similar to Belizeans by Female Poverty
In terms of female poverty, the demographic groups most similar to Belizeans are Haitian (15.9%, a difference of 0.0%), Barbadian (15.9%, a difference of 0.010%), Immigrants from Barbados (16.0%, a difference of 0.070%), Central American (16.0%, a difference of 0.20%), and Immigrants from St. Vincent and the Grenadines (15.9%, a difference of 0.23%).
| Demographics | Rating | Rank | Female Poverty |
| Immigrants | Liberia | 0.1 /100 | #265 | Tragic 15.7% |
| Immigrants | El Salvador | 0.1 /100 | #266 | Tragic 15.7% |
| Sub-Saharan Africans | 0.1 /100 | #267 | Tragic 15.8% |
| Immigrants | Nicaragua | 0.1 /100 | #268 | Tragic 15.8% |
| Iroquois | 0.1 /100 | #269 | Tragic 15.8% |
| Chickasaw | 0.1 /100 | #270 | Tragic 15.9% |
| Immigrants | St. Vincent and the Grenadines | 0.0 /100 | #271 | Tragic 15.9% |
| Belizeans | 0.0 /100 | #272 | Tragic 15.9% |
| Haitians | 0.0 /100 | #273 | Tragic 15.9% |
| Barbadians | 0.0 /100 | #274 | Tragic 15.9% |
| Immigrants | Barbados | 0.0 /100 | #275 | Tragic 16.0% |
| Central Americans | 0.0 /100 | #276 | Tragic 16.0% |
| Bangladeshis | 0.0 /100 | #277 | Tragic 16.0% |
| Immigrants | West Indies | 0.0 /100 | #278 | Tragic 16.1% |
| Immigrants | Bahamas | 0.0 /100 | #279 | Tragic 16.1% |
Demographics Similar to Estonians by Female Poverty
In terms of female poverty, the demographic groups most similar to Estonians are Immigrants from Serbia (12.1%, a difference of 0.060%), Scandinavian (12.1%, a difference of 0.14%), Immigrants from Europe (12.1%, a difference of 0.15%), Immigrants from Sri Lanka (12.1%, a difference of 0.25%), and Immigrants from Australia (12.2%, a difference of 0.39%).
| Demographics | Rating | Rank | Female Poverty |
| Immigrants | Romania | 99.0 /100 | #49 | Exceptional 12.0% |
| Slovenes | 98.9 /100 | #50 | Exceptional 12.0% |
| Immigrants | Bulgaria | 98.9 /100 | #51 | Exceptional 12.0% |
| Immigrants | Croatia | 98.7 /100 | #52 | Exceptional 12.0% |
| Immigrants | Austria | 98.7 /100 | #53 | Exceptional 12.0% |
| Immigrants | Philippines | 98.7 /100 | #54 | Exceptional 12.1% |
| Immigrants | Sri Lanka | 98.5 /100 | #55 | Exceptional 12.1% |
| Estonians | 98.3 /100 | #56 | Exceptional 12.1% |
| Immigrants | Serbia | 98.3 /100 | #57 | Exceptional 12.1% |
| Scandinavians | 98.2 /100 | #58 | Exceptional 12.1% |
| Immigrants | Europe | 98.2 /100 | #59 | Exceptional 12.1% |
| Immigrants | Australia | 98.1 /100 | #60 | Exceptional 12.2% |
| Immigrants | Asia | 98.1 /100 | #61 | Exceptional 12.2% |
| Immigrants | Italy | 98.0 /100 | #62 | Exceptional 12.2% |
| Ukrainians | 98.0 /100 | #63 | Exceptional 12.2% |