Belizean vs British West Indian Male Poverty
COMPARE
Belizean
British West Indian
Male Poverty
Male Poverty Comparison
Belizeans
British West Indians
13.6%
MALE POVERTY
0.0/ 100
METRIC RATING
278th/ 347
METRIC RANK
14.6%
MALE POVERTY
0.0/ 100
METRIC RATING
316th/ 347
METRIC RANK
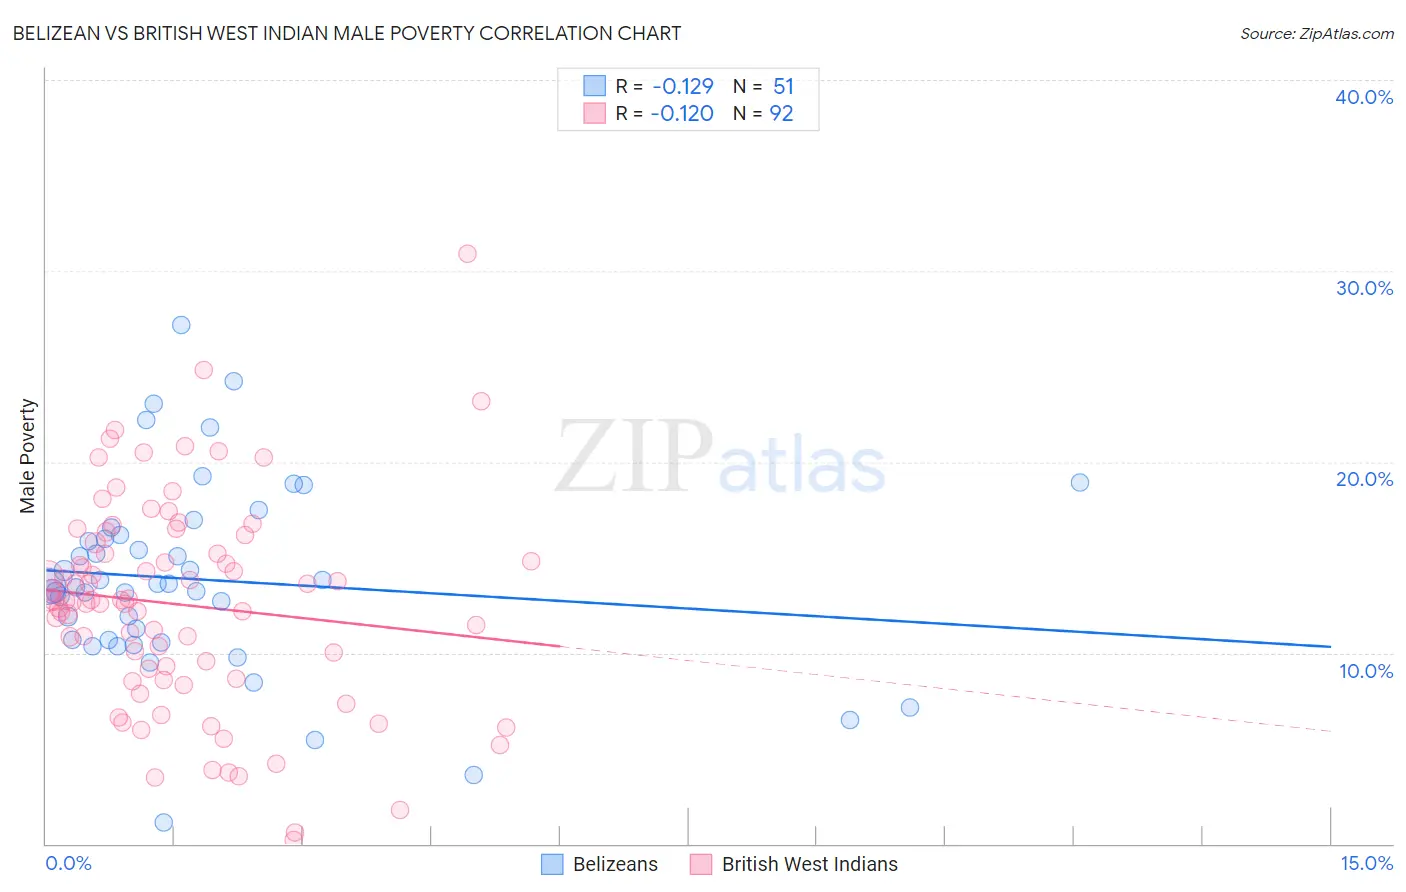
Belizean vs British West Indian Male Poverty Correlation Chart
The statistical analysis conducted on geographies consisting of 144,147,961 people shows a poor negative correlation between the proportion of Belizeans and poverty level among males in the United States with a correlation coefficient (R) of -0.129 and weighted average of 13.6%. Similarly, the statistical analysis conducted on geographies consisting of 152,618,428 people shows a poor negative correlation between the proportion of British West Indians and poverty level among males in the United States with a correlation coefficient (R) of -0.120 and weighted average of 14.6%, a difference of 7.0%.
Male Poverty Correlation Summary
| Measurement | Belizean | British West Indian |
| Minimum | 1.1% | 0.21% |
| Maximum | 27.1% | 30.9% |
| Range | 26.0% | 30.7% |
| Mean | 13.8% | 12.5% |
| Median | 13.5% | 12.7% |
| Interquartile 25% (IQ1) | 10.7% | 8.9% |
| Interquartile 75% (IQ3) | 16.2% | 15.5% |
| Interquartile Range (IQR) | 5.5% | 6.6% |
| Standard Deviation (Sample) | 5.0% | 5.5% |
| Standard Deviation (Population) | 4.9% | 5.5% |
Similar Demographics by Male Poverty
Demographics Similar to Belizeans by Male Poverty
In terms of male poverty, the demographic groups most similar to Belizeans are Bangladeshi (13.6%, a difference of 0.10%), Haitian (13.7%, a difference of 0.18%), Immigrants from Latin America (13.6%, a difference of 0.24%), Mexican (13.7%, a difference of 0.27%), and Yaqui (13.7%, a difference of 0.32%).
| Demographics | Rating | Rank | Male Poverty |
| Spanish Americans | 0.0 /100 | #271 | Tragic 13.4% |
| Immigrants | Bahamas | 0.0 /100 | #272 | Tragic 13.5% |
| Chickasaw | 0.0 /100 | #273 | Tragic 13.5% |
| Immigrants | West Indies | 0.0 /100 | #274 | Tragic 13.5% |
| Barbadians | 0.0 /100 | #275 | Tragic 13.6% |
| Immigrants | Latin America | 0.0 /100 | #276 | Tragic 13.6% |
| Bangladeshis | 0.0 /100 | #277 | Tragic 13.6% |
| Belizeans | 0.0 /100 | #278 | Tragic 13.6% |
| Haitians | 0.0 /100 | #279 | Tragic 13.7% |
| Mexicans | 0.0 /100 | #280 | Tragic 13.7% |
| Yaqui | 0.0 /100 | #281 | Tragic 13.7% |
| Immigrants | Cabo Verde | 0.0 /100 | #282 | Tragic 13.7% |
| Comanche | 0.0 /100 | #283 | Tragic 13.8% |
| Immigrants | Haiti | 0.0 /100 | #284 | Tragic 13.8% |
| West Indians | 0.0 /100 | #285 | Tragic 13.8% |
Demographics Similar to British West Indians by Male Poverty
In terms of male poverty, the demographic groups most similar to British West Indians are Chippewa (14.6%, a difference of 0.020%), Immigrants from Honduras (14.6%, a difference of 0.10%), Immigrants from Somalia (14.6%, a difference of 0.14%), Immigrants from Dominica (14.7%, a difference of 0.68%), and Immigrants from Grenada (14.7%, a difference of 0.74%).
| Demographics | Rating | Rank | Male Poverty |
| Somalis | 0.0 /100 | #309 | Tragic 14.3% |
| Seminole | 0.0 /100 | #310 | Tragic 14.3% |
| Hondurans | 0.0 /100 | #311 | Tragic 14.3% |
| Choctaw | 0.0 /100 | #312 | Tragic 14.4% |
| Immigrants | Somalia | 0.0 /100 | #313 | Tragic 14.6% |
| Immigrants | Honduras | 0.0 /100 | #314 | Tragic 14.6% |
| Chippewa | 0.0 /100 | #315 | Tragic 14.6% |
| British West Indians | 0.0 /100 | #316 | Tragic 14.6% |
| Immigrants | Dominica | 0.0 /100 | #317 | Tragic 14.7% |
| Immigrants | Grenada | 0.0 /100 | #318 | Tragic 14.7% |
| U.S. Virgin Islanders | 0.0 /100 | #319 | Tragic 14.7% |
| Immigrants | Congo | 0.0 /100 | #320 | Tragic 14.7% |
| Arapaho | 0.0 /100 | #321 | Tragic 15.1% |
| Kiowa | 0.0 /100 | #322 | Tragic 15.2% |
| Colville | 0.0 /100 | #323 | Tragic 15.2% |