Belgian vs Immigrants from Cameroon Child Poverty Among Girls Under 16
COMPARE
Belgian
Immigrants from Cameroon
Child Poverty Among Girls Under 16
Child Poverty Among Girls Under 16 Comparison
Belgians
Immigrants from Cameroon
15.2%
CHILD POVERTY AMONG GIRLS UNDER 16
93.9/ 100
METRIC RATING
115th/ 347
METRIC RANK
17.4%
CHILD POVERTY AMONG GIRLS UNDER 16
12.6/ 100
METRIC RATING
205th/ 347
METRIC RANK
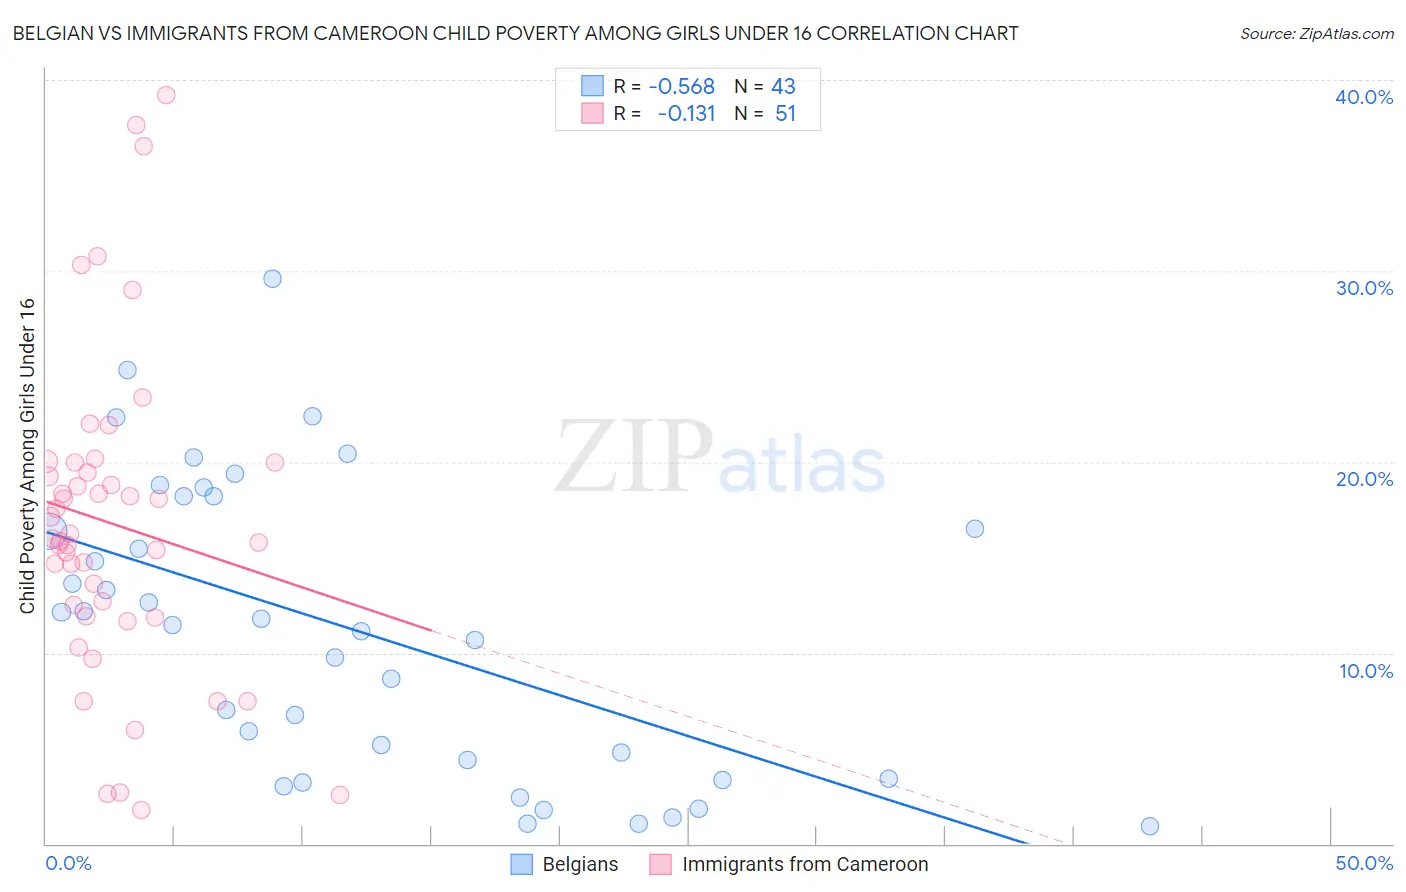
Belgian vs Immigrants from Cameroon Child Poverty Among Girls Under 16 Correlation Chart
The statistical analysis conducted on geographies consisting of 348,783,790 people shows a substantial negative correlation between the proportion of Belgians and poverty level among girls under the age of 16 in the United States with a correlation coefficient (R) of -0.568 and weighted average of 15.2%. Similarly, the statistical analysis conducted on geographies consisting of 130,176,141 people shows a poor negative correlation between the proportion of Immigrants from Cameroon and poverty level among girls under the age of 16 in the United States with a correlation coefficient (R) of -0.131 and weighted average of 17.4%, a difference of 14.6%.
Child Poverty Among Girls Under 16 Correlation Summary
| Measurement | Belgian | Immigrants from Cameroon |
| Minimum | 0.93% | 1.8% |
| Maximum | 29.6% | 39.2% |
| Range | 28.6% | 37.4% |
| Mean | 11.2% | 16.8% |
| Median | 11.4% | 16.0% |
| Interquartile 25% (IQ1) | 3.4% | 11.9% |
| Interquartile 75% (IQ3) | 18.2% | 19.9% |
| Interquartile Range (IQR) | 14.8% | 8.0% |
| Standard Deviation (Sample) | 7.6% | 8.3% |
| Standard Deviation (Population) | 7.5% | 8.2% |
Similar Demographics by Child Poverty Among Girls Under 16
Demographics Similar to Belgians by Child Poverty Among Girls Under 16
In terms of child poverty among girls under 16, the demographic groups most similar to Belgians are Sri Lankan (15.2%, a difference of 0.060%), Dutch (15.1%, a difference of 0.19%), Immigrants from Kazakhstan (15.1%, a difference of 0.21%), Immigrants from Denmark (15.2%, a difference of 0.31%), and Palestinian (15.1%, a difference of 0.35%).
| Demographics | Rating | Rank | Child Poverty Among Girls Under 16 |
| Immigrants | Brazil | 94.9 /100 | #108 | Exceptional 15.1% |
| Serbians | 94.8 /100 | #109 | Exceptional 15.1% |
| Immigrants | Croatia | 94.6 /100 | #110 | Exceptional 15.1% |
| Palestinians | 94.5 /100 | #111 | Exceptional 15.1% |
| Immigrants | Kazakhstan | 94.3 /100 | #112 | Exceptional 15.1% |
| Dutch | 94.3 /100 | #113 | Exceptional 15.1% |
| Sri Lankans | 94.0 /100 | #114 | Exceptional 15.2% |
| Belgians | 93.9 /100 | #115 | Exceptional 15.2% |
| Immigrants | Denmark | 93.3 /100 | #116 | Exceptional 15.2% |
| Immigrants | North Macedonia | 93.1 /100 | #117 | Exceptional 15.2% |
| Immigrants | Southern Europe | 92.7 /100 | #118 | Exceptional 15.3% |
| Immigrants | Zimbabwe | 92.5 /100 | #119 | Exceptional 15.3% |
| Pakistanis | 92.3 /100 | #120 | Exceptional 15.3% |
| English | 92.2 /100 | #121 | Exceptional 15.3% |
| Portuguese | 91.8 /100 | #122 | Exceptional 15.3% |
Demographics Similar to Immigrants from Cameroon by Child Poverty Among Girls Under 16
In terms of child poverty among girls under 16, the demographic groups most similar to Immigrants from Cameroon are Iraqi (17.4%, a difference of 0.10%), Delaware (17.4%, a difference of 0.27%), Hmong (17.5%, a difference of 0.52%), Sierra Leonean (17.6%, a difference of 1.1%), and Ugandan (17.2%, a difference of 1.1%).
| Demographics | Rating | Rank | Child Poverty Among Girls Under 16 |
| Immigrants | Lebanon | 22.6 /100 | #198 | Fair 17.1% |
| Immigrants | Afghanistan | 22.4 /100 | #199 | Fair 17.1% |
| Immigrants | Uzbekistan | 21.5 /100 | #200 | Fair 17.1% |
| Immigrants | Kenya | 17.8 /100 | #201 | Poor 17.2% |
| Immigrants | Sierra Leone | 17.6 /100 | #202 | Poor 17.2% |
| Ugandans | 17.5 /100 | #203 | Poor 17.2% |
| Iraqis | 13.0 /100 | #204 | Poor 17.4% |
| Immigrants | Cameroon | 12.6 /100 | #205 | Poor 17.4% |
| Delaware | 11.5 /100 | #206 | Poor 17.4% |
| Hmong | 10.6 /100 | #207 | Poor 17.5% |
| Sierra Leoneans | 8.9 /100 | #208 | Tragic 17.6% |
| Panamanians | 8.7 /100 | #209 | Tragic 17.6% |
| Immigrants | Immigrants | 7.3 /100 | #210 | Tragic 17.7% |
| Immigrants | Eastern Africa | 6.4 /100 | #211 | Tragic 17.7% |
| Immigrants | Thailand | 6.3 /100 | #212 | Tragic 17.7% |