Basque vs Nigerian Single Father Poverty
COMPARE
Basque
Nigerian
Single Father Poverty
Single Father Poverty Comparison
Basques
Nigerians
15.5%
SINGLE FATHER POVERTY
98.4/ 100
METRIC RATING
93rd/ 347
METRIC RANK
16.1%
SINGLE FATHER POVERTY
76.8/ 100
METRIC RATING
148th/ 347
METRIC RANK
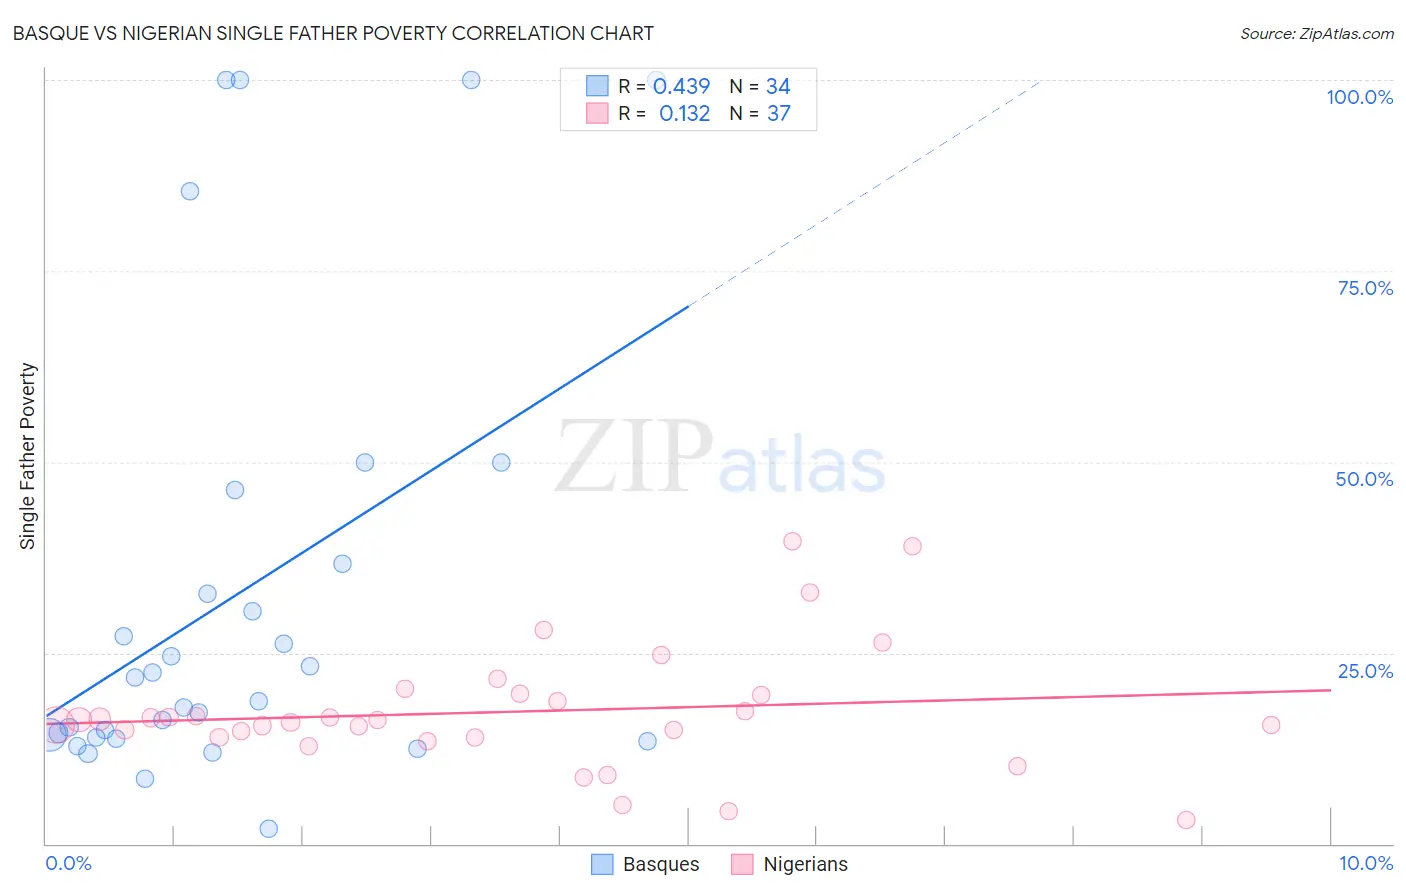
Basque vs Nigerian Single Father Poverty Correlation Chart
The statistical analysis conducted on geographies consisting of 144,984,159 people shows a moderate positive correlation between the proportion of Basques and poverty level among single fathers in the United States with a correlation coefficient (R) of 0.439 and weighted average of 15.5%. Similarly, the statistical analysis conducted on geographies consisting of 274,896,002 people shows a poor positive correlation between the proportion of Nigerians and poverty level among single fathers in the United States with a correlation coefficient (R) of 0.132 and weighted average of 16.1%, a difference of 3.4%.
Single Father Poverty Correlation Summary
| Measurement | Basque | Nigerian |
| Minimum | 2.0% | 3.1% |
| Maximum | 100.0% | 39.7% |
| Range | 98.0% | 36.6% |
| Mean | 32.5% | 17.3% |
| Median | 20.2% | 16.2% |
| Interquartile 25% (IQ1) | 13.9% | 13.9% |
| Interquartile 75% (IQ3) | 36.7% | 19.6% |
| Interquartile Range (IQR) | 22.8% | 5.7% |
| Standard Deviation (Sample) | 29.5% | 8.0% |
| Standard Deviation (Population) | 29.0% | 7.9% |
Similar Demographics by Single Father Poverty
Demographics Similar to Basques by Single Father Poverty
In terms of single father poverty, the demographic groups most similar to Basques are Immigrants from Serbia (15.5%, a difference of 0.040%), Immigrants from Uruguay (15.6%, a difference of 0.14%), Immigrants from Romania (15.5%, a difference of 0.15%), Immigrants from Kazakhstan (15.6%, a difference of 0.19%), and Immigrants from Belgium (15.6%, a difference of 0.20%).
| Demographics | Rating | Rank | Single Father Poverty |
| Immigrants | Russia | 99.0 /100 | #86 | Exceptional 15.5% |
| Brazilians | 99.0 /100 | #87 | Exceptional 15.5% |
| Burmese | 99.0 /100 | #88 | Exceptional 15.5% |
| Immigrants | Korea | 99.0 /100 | #89 | Exceptional 15.5% |
| Mexican American Indians | 98.7 /100 | #90 | Exceptional 15.5% |
| Immigrants | Romania | 98.6 /100 | #91 | Exceptional 15.5% |
| Immigrants | Serbia | 98.5 /100 | #92 | Exceptional 15.5% |
| Basques | 98.4 /100 | #93 | Exceptional 15.5% |
| Immigrants | Uruguay | 98.2 /100 | #94 | Exceptional 15.6% |
| Immigrants | Kazakhstan | 98.2 /100 | #95 | Exceptional 15.6% |
| Immigrants | Belgium | 98.1 /100 | #96 | Exceptional 15.6% |
| Yaqui | 98.1 /100 | #97 | Exceptional 15.6% |
| Zimbabweans | 98.1 /100 | #98 | Exceptional 15.6% |
| Immigrants | Middle Africa | 97.4 /100 | #99 | Exceptional 15.6% |
| Immigrants | Chile | 96.9 /100 | #100 | Exceptional 15.7% |
Demographics Similar to Nigerians by Single Father Poverty
In terms of single father poverty, the demographic groups most similar to Nigerians are Colombian (16.1%, a difference of 0.020%), Immigrants from Hungary (16.1%, a difference of 0.10%), South African (16.1%, a difference of 0.10%), Jordanian (16.1%, a difference of 0.16%), and Immigrants from France (16.1%, a difference of 0.22%).
| Demographics | Rating | Rank | Single Father Poverty |
| Liberians | 83.3 /100 | #141 | Excellent 16.0% |
| Immigrants | Mexico | 83.3 /100 | #142 | Excellent 16.0% |
| Immigrants | Central America | 83.1 /100 | #143 | Excellent 16.0% |
| Immigrants | Kuwait | 81.4 /100 | #144 | Excellent 16.0% |
| Immigrants | Western Asia | 80.7 /100 | #145 | Excellent 16.0% |
| Immigrants | Hungary | 78.3 /100 | #146 | Good 16.1% |
| Colombians | 77.1 /100 | #147 | Good 16.1% |
| Nigerians | 76.8 /100 | #148 | Good 16.1% |
| South Africans | 75.1 /100 | #149 | Good 16.1% |
| Jordanians | 74.2 /100 | #150 | Good 16.1% |
| Immigrants | France | 73.1 /100 | #151 | Good 16.1% |
| Immigrants | Zimbabwe | 72.1 /100 | #152 | Good 16.1% |
| Immigrants | Israel | 72.0 /100 | #153 | Good 16.1% |
| Mexicans | 70.1 /100 | #154 | Good 16.1% |
| Immigrants | Nicaragua | 67.8 /100 | #155 | Good 16.2% |