Barbadian vs Immigrants from Romania Single Female Poverty
COMPARE
Barbadian
Immigrants from Romania
Single Female Poverty
Single Female Poverty Comparison
Barbadians
Immigrants from Romania
21.8%
SINGLE FEMALE POVERTY
7.2/ 100
METRIC RATING
224th/ 347
METRIC RANK
18.8%
SINGLE FEMALE POVERTY
99.9/ 100
METRIC RATING
43rd/ 347
METRIC RANK
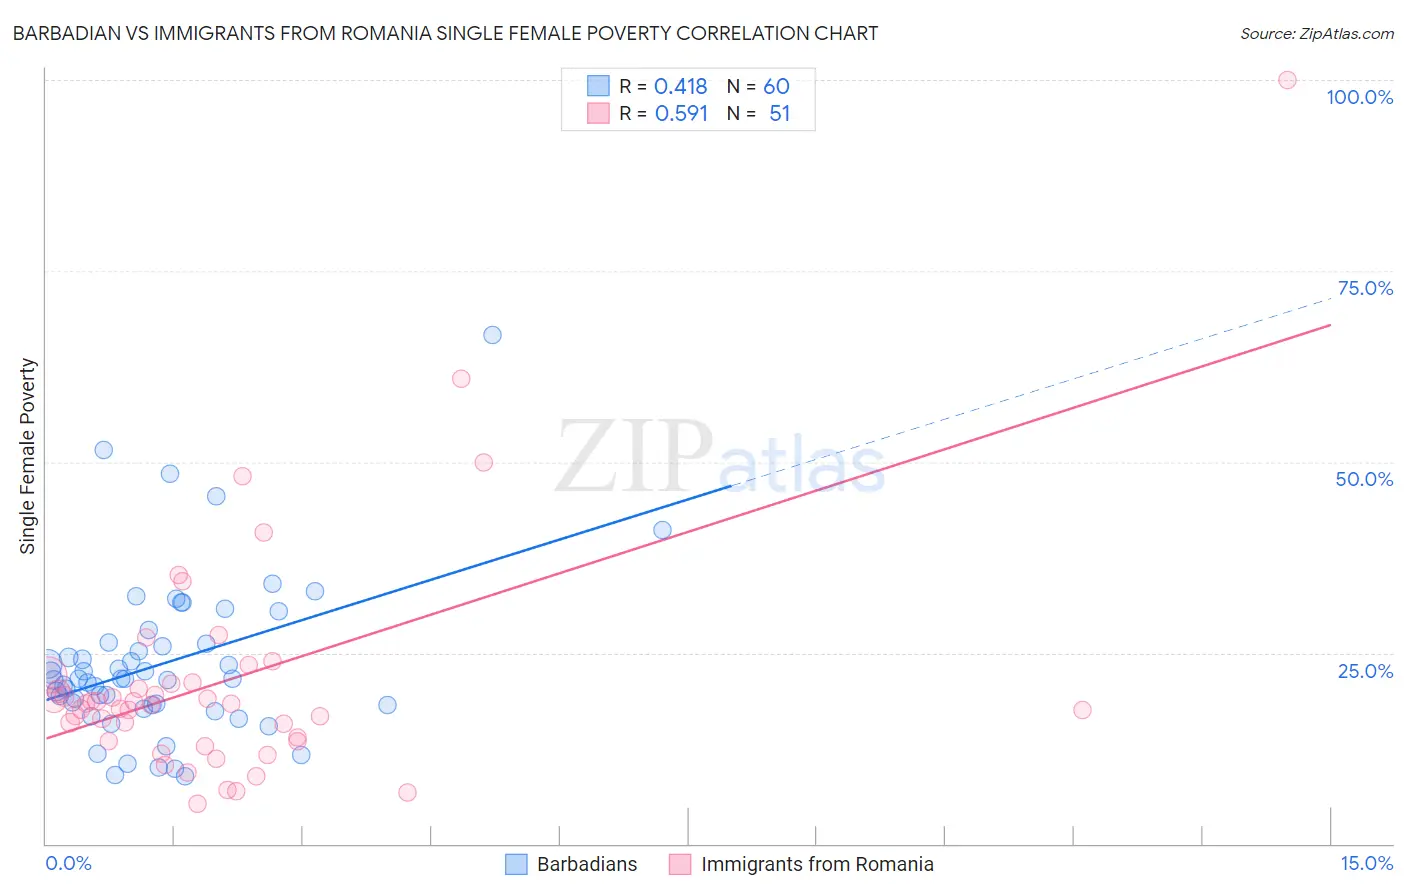
Barbadian vs Immigrants from Romania Single Female Poverty Correlation Chart
The statistical analysis conducted on geographies consisting of 140,678,915 people shows a moderate positive correlation between the proportion of Barbadians and poverty level among single females in the United States with a correlation coefficient (R) of 0.418 and weighted average of 21.8%. Similarly, the statistical analysis conducted on geographies consisting of 254,376,234 people shows a substantial positive correlation between the proportion of Immigrants from Romania and poverty level among single females in the United States with a correlation coefficient (R) of 0.591 and weighted average of 18.8%, a difference of 15.9%.
Single Female Poverty Correlation Summary
| Measurement | Barbadian | Immigrants from Romania |
| Minimum | 8.9% | 5.2% |
| Maximum | 66.7% | 100.0% |
| Range | 57.8% | 94.8% |
| Mean | 23.6% | 21.4% |
| Median | 21.6% | 18.3% |
| Interquartile 25% (IQ1) | 18.1% | 13.5% |
| Interquartile 75% (IQ3) | 26.3% | 21.2% |
| Interquartile Range (IQR) | 8.1% | 7.7% |
| Standard Deviation (Sample) | 10.6% | 15.7% |
| Standard Deviation (Population) | 10.5% | 15.5% |
Similar Demographics by Single Female Poverty
Demographics Similar to Barbadians by Single Female Poverty
In terms of single female poverty, the demographic groups most similar to Barbadians are Scottish (21.8%, a difference of 0.020%), Immigrants from Eritrea (21.8%, a difference of 0.16%), Immigrants from Grenada (21.8%, a difference of 0.17%), English (21.9%, a difference of 0.18%), and German (21.8%, a difference of 0.23%).
| Demographics | Rating | Rank | Single Female Poverty |
| Immigrants | St. Vincent and the Grenadines | 11.7 /100 | #217 | Poor 21.7% |
| Nepalese | 9.7 /100 | #218 | Tragic 21.7% |
| Panamanians | 9.4 /100 | #219 | Tragic 21.7% |
| Germans | 8.3 /100 | #220 | Tragic 21.8% |
| Immigrants | Grenada | 8.0 /100 | #221 | Tragic 21.8% |
| Immigrants | Eritrea | 7.9 /100 | #222 | Tragic 21.8% |
| Scottish | 7.3 /100 | #223 | Tragic 21.8% |
| Barbadians | 7.2 /100 | #224 | Tragic 21.8% |
| English | 6.4 /100 | #225 | Tragic 21.9% |
| Immigrants | Portugal | 5.8 /100 | #226 | Tragic 21.9% |
| Immigrants | Ghana | 5.8 /100 | #227 | Tragic 21.9% |
| Salvadorans | 5.5 /100 | #228 | Tragic 21.9% |
| Tlingit-Haida | 5.4 /100 | #229 | Tragic 21.9% |
| Immigrants | Western Africa | 5.3 /100 | #230 | Tragic 22.0% |
| Welsh | 5.0 /100 | #231 | Tragic 22.0% |
Demographics Similar to Immigrants from Romania by Single Female Poverty
In terms of single female poverty, the demographic groups most similar to Immigrants from Romania are Jordanian (18.8%, a difference of 0.15%), Immigrants from Croatia (18.9%, a difference of 0.17%), Immigrants from Serbia (18.8%, a difference of 0.23%), Okinawan (18.8%, a difference of 0.25%), and Bulgarian (18.8%, a difference of 0.28%).
| Demographics | Rating | Rank | Single Female Poverty |
| Turks | 99.9 /100 | #36 | Exceptional 18.7% |
| Immigrants | Armenia | 99.9 /100 | #37 | Exceptional 18.7% |
| Tongans | 99.9 /100 | #38 | Exceptional 18.8% |
| Bulgarians | 99.9 /100 | #39 | Exceptional 18.8% |
| Okinawans | 99.9 /100 | #40 | Exceptional 18.8% |
| Immigrants | Serbia | 99.9 /100 | #41 | Exceptional 18.8% |
| Jordanians | 99.9 /100 | #42 | Exceptional 18.8% |
| Immigrants | Romania | 99.9 /100 | #43 | Exceptional 18.8% |
| Immigrants | Croatia | 99.9 /100 | #44 | Exceptional 18.9% |
| Immigrants | Indonesia | 99.8 /100 | #45 | Exceptional 18.9% |
| Macedonians | 99.8 /100 | #46 | Exceptional 18.9% |
| Latvians | 99.8 /100 | #47 | Exceptional 19.0% |
| Immigrants | Argentina | 99.8 /100 | #48 | Exceptional 19.0% |
| Immigrants | Czechoslovakia | 99.8 /100 | #49 | Exceptional 19.0% |
| Immigrants | Eastern Europe | 99.8 /100 | #50 | Exceptional 19.0% |