Barbadian vs Immigrants from Bulgaria Single Father Poverty
COMPARE
Barbadian
Immigrants from Bulgaria
Single Father Poverty
Single Father Poverty Comparison
Barbadians
Immigrants from Bulgaria
17.5%
SINGLE FATHER POVERTY
0.1/ 100
METRIC RATING
272nd/ 347
METRIC RANK
15.0%
SINGLE FATHER POVERTY
99.9/ 100
METRIC RATING
55th/ 347
METRIC RANK
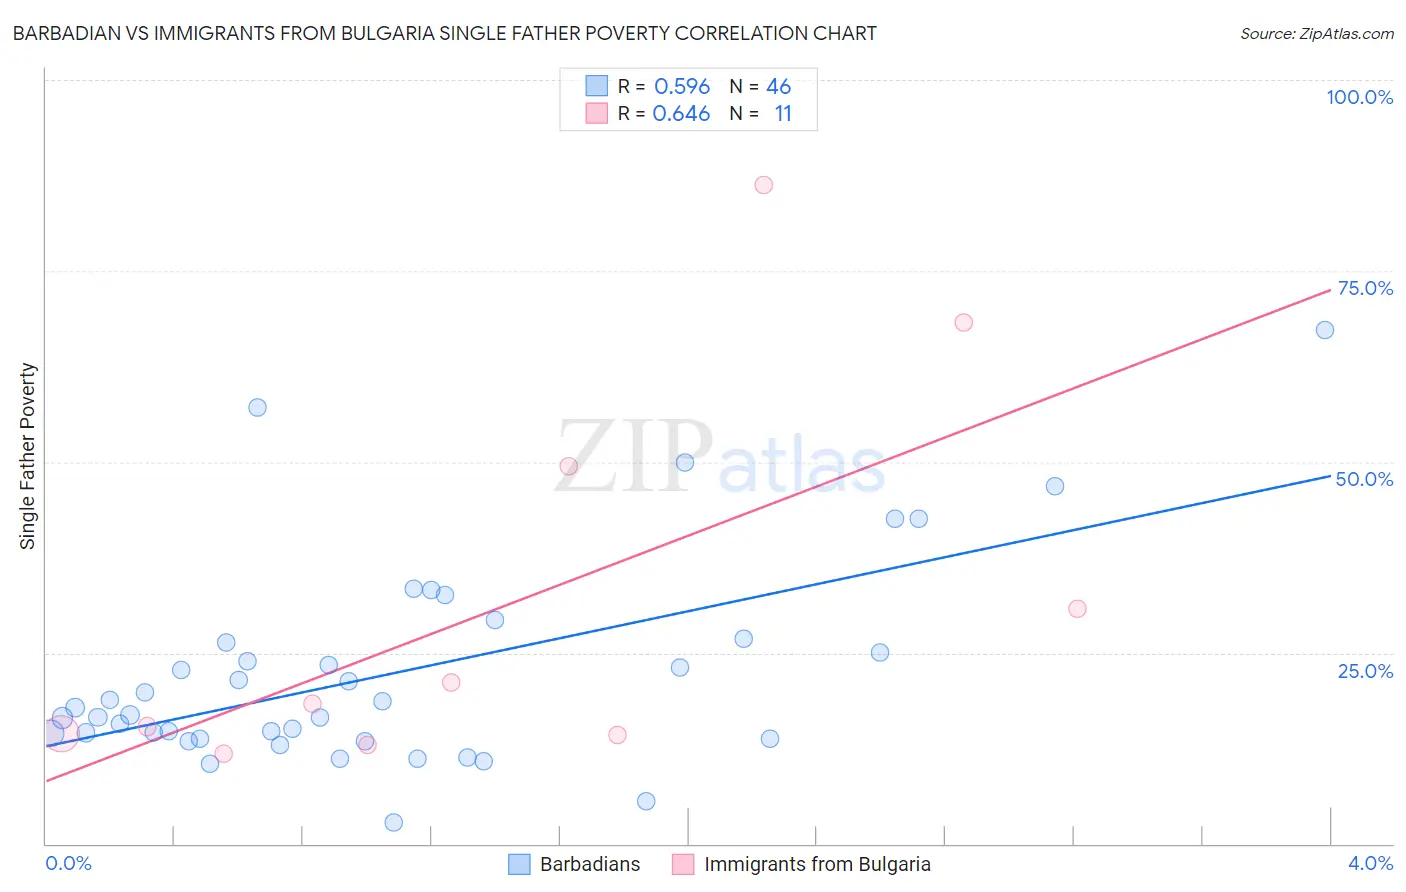
Barbadian vs Immigrants from Bulgaria Single Father Poverty Correlation Chart
The statistical analysis conducted on geographies consisting of 128,228,135 people shows a substantial positive correlation between the proportion of Barbadians and poverty level among single fathers in the United States with a correlation coefficient (R) of 0.596 and weighted average of 17.5%. Similarly, the statistical analysis conducted on geographies consisting of 145,942,181 people shows a significant positive correlation between the proportion of Immigrants from Bulgaria and poverty level among single fathers in the United States with a correlation coefficient (R) of 0.646 and weighted average of 15.0%, a difference of 16.5%.
Single Father Poverty Correlation Summary
| Measurement | Barbadian | Immigrants from Bulgaria |
| Minimum | 2.8% | 11.8% |
| Maximum | 67.2% | 86.2% |
| Range | 64.4% | 74.4% |
| Mean | 22.3% | 31.2% |
| Median | 17.4% | 18.3% |
| Interquartile 25% (IQ1) | 13.7% | 14.3% |
| Interquartile 75% (IQ3) | 26.3% | 49.4% |
| Interquartile Range (IQR) | 12.6% | 35.1% |
| Standard Deviation (Sample) | 13.4% | 25.5% |
| Standard Deviation (Population) | 13.3% | 24.4% |
Similar Demographics by Single Father Poverty
Demographics Similar to Barbadians by Single Father Poverty
In terms of single father poverty, the demographic groups most similar to Barbadians are Italian (17.5%, a difference of 0.28%), French American Indian (17.4%, a difference of 0.35%), Indonesian (17.4%, a difference of 0.48%), Slavic (17.4%, a difference of 0.74%), and Immigrants from Caribbean (17.4%, a difference of 0.81%).
| Demographics | Rating | Rank | Single Father Poverty |
| Poles | 0.3 /100 | #265 | Tragic 17.3% |
| Jamaicans | 0.3 /100 | #266 | Tragic 17.3% |
| Haitians | 0.3 /100 | #267 | Tragic 17.3% |
| Immigrants | Caribbean | 0.3 /100 | #268 | Tragic 17.4% |
| Slavs | 0.3 /100 | #269 | Tragic 17.4% |
| Indonesians | 0.2 /100 | #270 | Tragic 17.4% |
| French American Indians | 0.2 /100 | #271 | Tragic 17.4% |
| Barbadians | 0.1 /100 | #272 | Tragic 17.5% |
| Italians | 0.1 /100 | #273 | Tragic 17.5% |
| Macedonians | 0.1 /100 | #274 | Tragic 17.7% |
| British West Indians | 0.0 /100 | #275 | Tragic 17.7% |
| German Russians | 0.0 /100 | #276 | Tragic 17.7% |
| Lebanese | 0.0 /100 | #277 | Tragic 17.7% |
| Germans | 0.0 /100 | #278 | Tragic 17.7% |
| Iroquois | 0.0 /100 | #279 | Tragic 17.7% |
Demographics Similar to Immigrants from Bulgaria by Single Father Poverty
In terms of single father poverty, the demographic groups most similar to Immigrants from Bulgaria are Immigrants from Uzbekistan (15.0%, a difference of 0.050%), Immigrants from Kenya (15.0%, a difference of 0.23%), Immigrants from El Salvador (15.0%, a difference of 0.26%), Immigrants from Laos (15.1%, a difference of 0.28%), and Immigrants from Pakistan (15.0%, a difference of 0.30%).
| Demographics | Rating | Rank | Single Father Poverty |
| Malaysians | 99.9 /100 | #48 | Exceptional 14.9% |
| Immigrants | Eastern Asia | 99.9 /100 | #49 | Exceptional 15.0% |
| Bhutanese | 99.9 /100 | #50 | Exceptional 15.0% |
| Immigrants | Pakistan | 99.9 /100 | #51 | Exceptional 15.0% |
| Immigrants | El Salvador | 99.9 /100 | #52 | Exceptional 15.0% |
| Immigrants | Kenya | 99.9 /100 | #53 | Exceptional 15.0% |
| Immigrants | Uzbekistan | 99.9 /100 | #54 | Exceptional 15.0% |
| Immigrants | Bulgaria | 99.9 /100 | #55 | Exceptional 15.0% |
| Immigrants | Laos | 99.9 /100 | #56 | Exceptional 15.1% |
| Laotians | 99.9 /100 | #57 | Exceptional 15.1% |
| Hawaiians | 99.9 /100 | #58 | Exceptional 15.1% |
| Guamanians/Chamorros | 99.9 /100 | #59 | Exceptional 15.1% |
| Puget Sound Salish | 99.8 /100 | #60 | Exceptional 15.2% |
| Immigrants | Bosnia and Herzegovina | 99.8 /100 | #61 | Exceptional 15.2% |
| Immigrants | Armenia | 99.8 /100 | #62 | Exceptional 15.2% |