Bangladeshi vs Immigrants from Kenya Single Father Poverty
COMPARE
Bangladeshi
Immigrants from Kenya
Single Father Poverty
Single Father Poverty Comparison
Bangladeshis
Immigrants from Kenya
15.2%
SINGLE FATHER POVERTY
99.8/ 100
METRIC RATING
64th/ 347
METRIC RANK
15.0%
SINGLE FATHER POVERTY
99.9/ 100
METRIC RATING
53rd/ 347
METRIC RANK
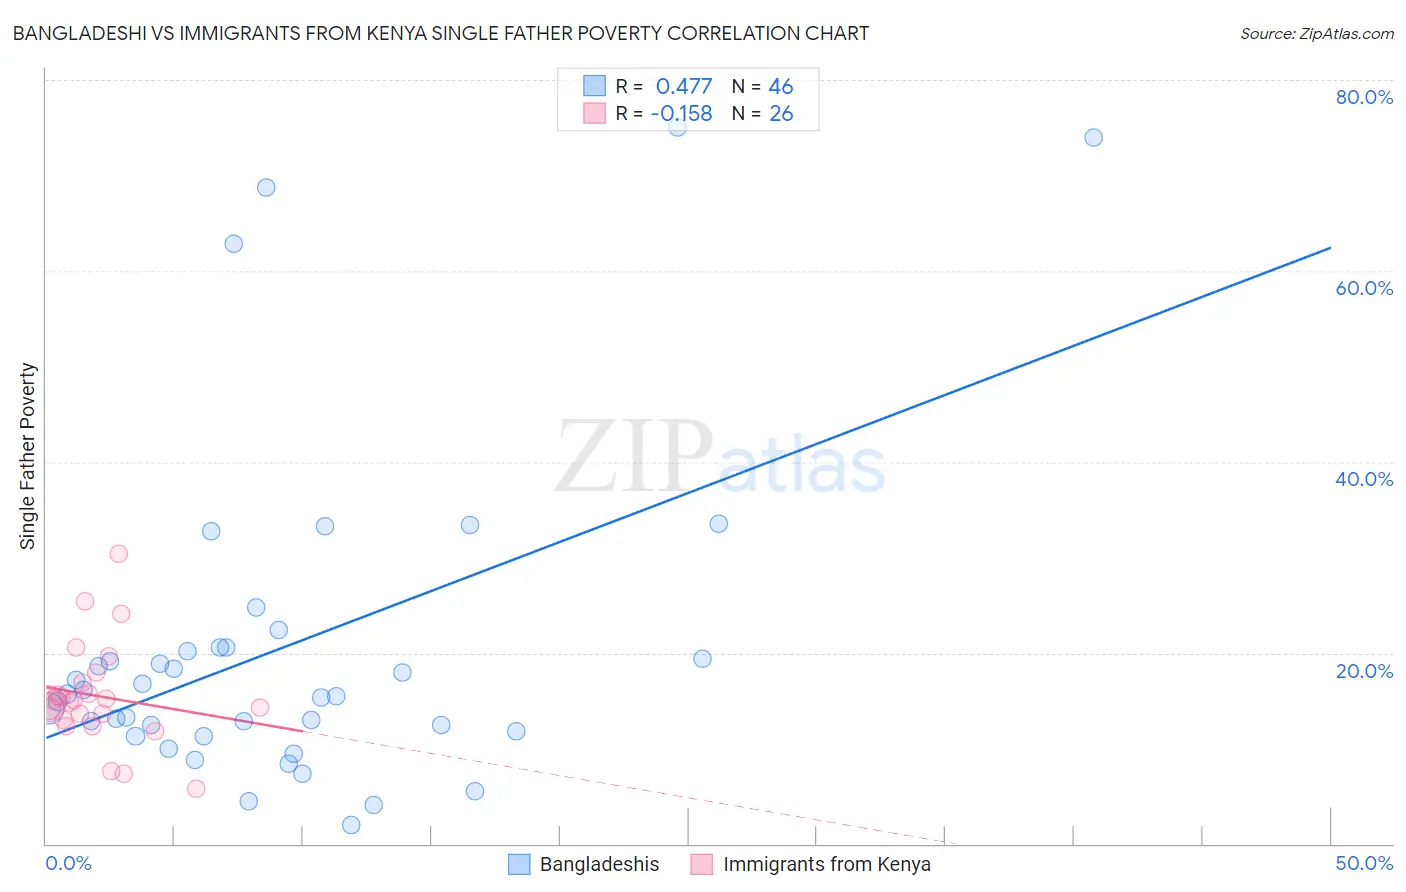
Bangladeshi vs Immigrants from Kenya Single Father Poverty Correlation Chart
The statistical analysis conducted on geographies consisting of 125,568,753 people shows a moderate positive correlation between the proportion of Bangladeshis and poverty level among single fathers in the United States with a correlation coefficient (R) of 0.477 and weighted average of 15.2%. Similarly, the statistical analysis conducted on geographies consisting of 185,887,734 people shows a poor negative correlation between the proportion of Immigrants from Kenya and poverty level among single fathers in the United States with a correlation coefficient (R) of -0.158 and weighted average of 15.0%, a difference of 1.4%.
Single Father Poverty Correlation Summary
| Measurement | Bangladeshi | Immigrants from Kenya |
| Minimum | 2.0% | 5.7% |
| Maximum | 75.0% | 30.4% |
| Range | 73.0% | 24.7% |
| Mean | 20.5% | 15.5% |
| Median | 15.5% | 14.9% |
| Interquartile 25% (IQ1) | 11.7% | 13.0% |
| Interquartile 75% (IQ3) | 20.6% | 16.9% |
| Interquartile Range (IQR) | 8.8% | 3.9% |
| Standard Deviation (Sample) | 17.2% | 5.4% |
| Standard Deviation (Population) | 17.0% | 5.3% |
Demographics Similar to Bangladeshis and Immigrants from Kenya by Single Father Poverty
In terms of single father poverty, the demographic groups most similar to Bangladeshis are Immigrants from Sweden (15.2%, a difference of 0.080%), Immigrants from Malaysia (15.2%, a difference of 0.090%), Immigrants from Moldova (15.2%, a difference of 0.11%), Immigrants from Armenia (15.2%, a difference of 0.17%), and Immigrants from Bosnia and Herzegovina (15.2%, a difference of 0.18%). Similarly, the demographic groups most similar to Immigrants from Kenya are Immigrants from El Salvador (15.0%, a difference of 0.040%), Immigrants from Pakistan (15.0%, a difference of 0.070%), Bhutanese (15.0%, a difference of 0.090%), Immigrants from Eastern Asia (15.0%, a difference of 0.14%), and Immigrants from Uzbekistan (15.0%, a difference of 0.18%).
| Demographics | Rating | Rank | Single Father Poverty |
| Malaysians | 99.9 /100 | #48 | Exceptional 14.9% |
| Immigrants | Eastern Asia | 99.9 /100 | #49 | Exceptional 15.0% |
| Bhutanese | 99.9 /100 | #50 | Exceptional 15.0% |
| Immigrants | Pakistan | 99.9 /100 | #51 | Exceptional 15.0% |
| Immigrants | El Salvador | 99.9 /100 | #52 | Exceptional 15.0% |
| Immigrants | Kenya | 99.9 /100 | #53 | Exceptional 15.0% |
| Immigrants | Uzbekistan | 99.9 /100 | #54 | Exceptional 15.0% |
| Immigrants | Bulgaria | 99.9 /100 | #55 | Exceptional 15.0% |
| Immigrants | Laos | 99.9 /100 | #56 | Exceptional 15.1% |
| Laotians | 99.9 /100 | #57 | Exceptional 15.1% |
| Hawaiians | 99.9 /100 | #58 | Exceptional 15.1% |
| Guamanians/Chamorros | 99.9 /100 | #59 | Exceptional 15.1% |
| Puget Sound Salish | 99.8 /100 | #60 | Exceptional 15.2% |
| Immigrants | Bosnia and Herzegovina | 99.8 /100 | #61 | Exceptional 15.2% |
| Immigrants | Armenia | 99.8 /100 | #62 | Exceptional 15.2% |
| Immigrants | Sweden | 99.8 /100 | #63 | Exceptional 15.2% |
| Bangladeshis | 99.8 /100 | #64 | Exceptional 15.2% |
| Immigrants | Malaysia | 99.8 /100 | #65 | Exceptional 15.2% |
| Immigrants | Moldova | 99.8 /100 | #66 | Exceptional 15.2% |
| Paraguayans | 99.7 /100 | #67 | Exceptional 15.2% |
| Immigrants | Cameroon | 99.7 /100 | #68 | Exceptional 15.2% |