Bahamian vs South American Poverty
COMPARE
Bahamian
South American
Poverty
Poverty Comparison
Bahamians
South Americans
15.4%
POVERTY
0.0/ 100
METRIC RATING
301st/ 347
METRIC RANK
12.3%
POVERTY
48.7/ 100
METRIC RATING
175th/ 347
METRIC RANK
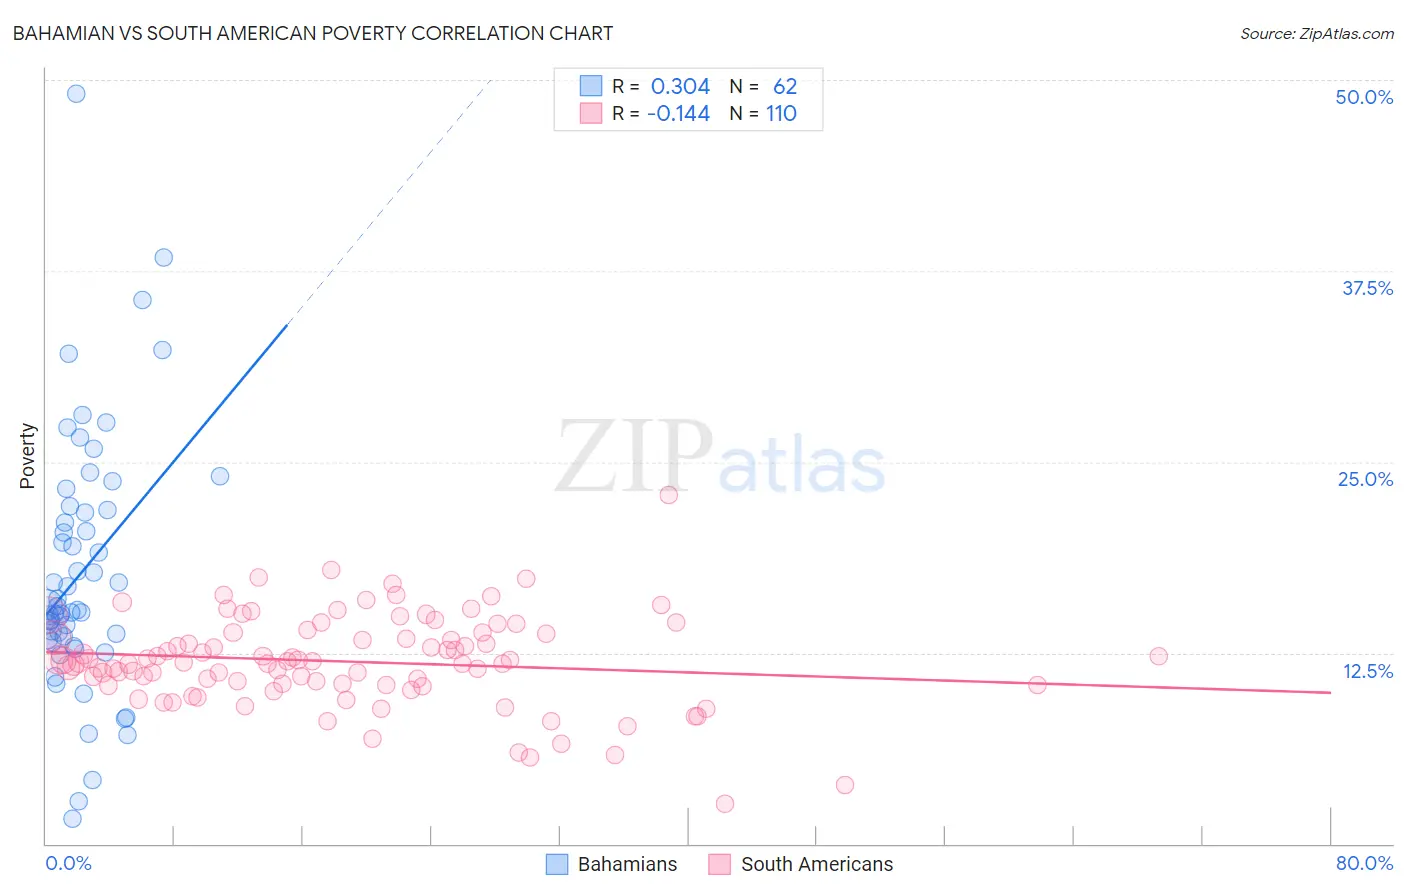
Bahamian vs South American Poverty Correlation Chart
The statistical analysis conducted on geographies consisting of 112,639,225 people shows a mild positive correlation between the proportion of Bahamians and poverty level in the United States with a correlation coefficient (R) of 0.304 and weighted average of 15.4%. Similarly, the statistical analysis conducted on geographies consisting of 493,572,716 people shows a poor negative correlation between the proportion of South Americans and poverty level in the United States with a correlation coefficient (R) of -0.144 and weighted average of 12.3%, a difference of 24.8%.
Poverty Correlation Summary
| Measurement | Bahamian | South American |
| Minimum | 1.7% | 2.6% |
| Maximum | 49.1% | 22.8% |
| Range | 47.4% | 20.2% |
| Mean | 17.8% | 11.9% |
| Median | 15.4% | 11.9% |
| Interquartile 25% (IQ1) | 13.4% | 10.4% |
| Interquartile 75% (IQ3) | 21.8% | 13.8% |
| Interquartile Range (IQR) | 8.4% | 3.4% |
| Standard Deviation (Sample) | 8.5% | 3.0% |
| Standard Deviation (Population) | 8.4% | 3.0% |
Similar Demographics by Poverty
Demographics Similar to Bahamians by Poverty
In terms of poverty, the demographic groups most similar to Bahamians are Somali (15.4%, a difference of 0.13%), Immigrants from Central America (15.4%, a difference of 0.21%), Senegalese (15.3%, a difference of 0.59%), Immigrants from Caribbean (15.5%, a difference of 0.61%), and Immigrants from Senegal (15.3%, a difference of 0.68%).
| Demographics | Rating | Rank | Poverty |
| Blackfeet | 0.0 /100 | #294 | Tragic 15.2% |
| Guatemalans | 0.0 /100 | #295 | Tragic 15.3% |
| Hispanics or Latinos | 0.0 /100 | #296 | Tragic 15.3% |
| Immigrants | Bangladesh | 0.0 /100 | #297 | Tragic 15.3% |
| Immigrants | Senegal | 0.0 /100 | #298 | Tragic 15.3% |
| Senegalese | 0.0 /100 | #299 | Tragic 15.3% |
| Immigrants | Central America | 0.0 /100 | #300 | Tragic 15.4% |
| Bahamians | 0.0 /100 | #301 | Tragic 15.4% |
| Somalis | 0.0 /100 | #302 | Tragic 15.4% |
| Immigrants | Caribbean | 0.0 /100 | #303 | Tragic 15.5% |
| Immigrants | Mexico | 0.0 /100 | #304 | Tragic 15.5% |
| Immigrants | Guatemala | 0.0 /100 | #305 | Tragic 15.5% |
| Creek | 0.0 /100 | #306 | Tragic 15.6% |
| Africans | 0.0 /100 | #307 | Tragic 15.6% |
| Choctaw | 0.0 /100 | #308 | Tragic 15.6% |
Demographics Similar to South Americans by Poverty
In terms of poverty, the demographic groups most similar to South Americans are Immigrants from Colombia (12.3%, a difference of 0.090%), Immigrants from Syria (12.3%, a difference of 0.12%), Lebanese (12.3%, a difference of 0.13%), Celtic (12.3%, a difference of 0.14%), and Immigrants from Portugal (12.3%, a difference of 0.18%).
| Demographics | Rating | Rank | Poverty |
| Immigrants | Venezuela | 56.5 /100 | #168 | Average 12.2% |
| Whites/Caucasians | 55.4 /100 | #169 | Average 12.3% |
| Immigrants | Oceania | 54.6 /100 | #170 | Average 12.3% |
| Immigrants | Spain | 51.3 /100 | #171 | Average 12.3% |
| Immigrants | Portugal | 50.5 /100 | #172 | Average 12.3% |
| Celtics | 50.1 /100 | #173 | Average 12.3% |
| Lebanese | 50.0 /100 | #174 | Average 12.3% |
| South Americans | 48.7 /100 | #175 | Average 12.3% |
| Immigrants | Colombia | 47.7 /100 | #176 | Average 12.3% |
| Immigrants | Syria | 47.5 /100 | #177 | Average 12.3% |
| Uruguayans | 44.7 /100 | #178 | Average 12.4% |
| Immigrants | Morocco | 44.0 /100 | #179 | Average 12.4% |
| Mongolians | 43.6 /100 | #180 | Average 12.4% |
| Immigrants | Afghanistan | 42.1 /100 | #181 | Average 12.4% |
| Immigrants | Cameroon | 41.7 /100 | #182 | Average 12.4% |