Bahamian vs Paiute Seniors Poverty Over the Age of 75
COMPARE
Bahamian
Paiute
Seniors Poverty Over the Age of 75
Seniors Poverty Over the Age of 75 Comparison
Bahamians
Paiute
15.5%
SENIORS POVERTY OVER THE AGE OF 75
0.0/ 100
METRIC RATING
300th/ 347
METRIC RANK
15.2%
SENIORS POVERTY OVER THE AGE OF 75
0.0/ 100
METRIC RATING
291st/ 347
METRIC RANK
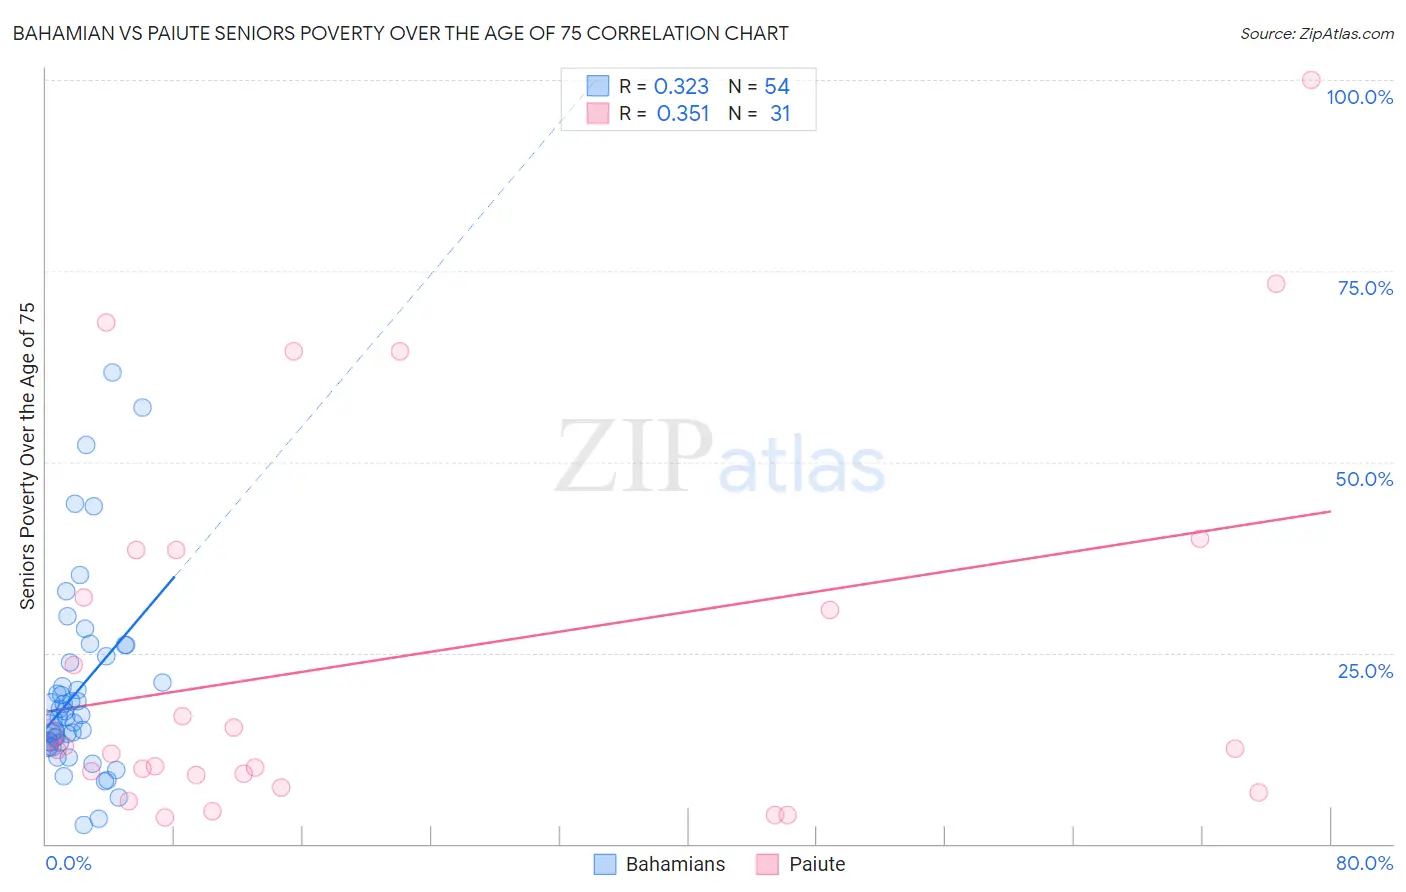
Bahamian vs Paiute Seniors Poverty Over the Age of 75 Correlation Chart
The statistical analysis conducted on geographies consisting of 112,239,118 people shows a mild positive correlation between the proportion of Bahamians and poverty level among seniors over the age of 75 in the United States with a correlation coefficient (R) of 0.323 and weighted average of 15.5%. Similarly, the statistical analysis conducted on geographies consisting of 58,252,540 people shows a mild positive correlation between the proportion of Paiute and poverty level among seniors over the age of 75 in the United States with a correlation coefficient (R) of 0.351 and weighted average of 15.2%, a difference of 2.1%.
Seniors Poverty Over the Age of 75 Correlation Summary
| Measurement | Bahamian | Paiute |
| Minimum | 2.5% | 3.5% |
| Maximum | 61.7% | 100.0% |
| Range | 59.2% | 96.5% |
| Mean | 20.0% | 24.6% |
| Median | 16.5% | 12.5% |
| Interquartile 25% (IQ1) | 13.3% | 9.0% |
| Interquartile 75% (IQ3) | 23.7% | 38.5% |
| Interquartile Range (IQR) | 10.4% | 29.5% |
| Standard Deviation (Sample) | 12.4% | 25.0% |
| Standard Deviation (Population) | 12.3% | 24.6% |
Demographics Similar to Bahamians and Paiute by Seniors Poverty Over the Age of 75
In terms of seniors poverty over the age of 75, the demographic groups most similar to Bahamians are Spanish American Indian (15.5%, a difference of 0.010%), Native/Alaskan (15.5%, a difference of 0.11%), Honduran (15.4%, a difference of 0.45%), Yuman (15.4%, a difference of 0.73%), and Immigrants from Latin America (15.6%, a difference of 0.78%). Similarly, the demographic groups most similar to Paiute are Immigrants from the Azores (15.2%, a difference of 0.020%), Immigrants from Belize (15.2%, a difference of 0.030%), Colville (15.2%, a difference of 0.18%), Jamaican (15.1%, a difference of 0.29%), and Apache (15.3%, a difference of 0.58%).
| Demographics | Rating | Rank | Seniors Poverty Over the Age of 75 |
| Immigrants | Mexico | 0.0 /100 | #285 | Tragic 14.9% |
| Immigrants | Central America | 0.0 /100 | #286 | Tragic 15.0% |
| Immigrants | Guatemala | 0.0 /100 | #287 | Tragic 15.1% |
| Jamaicans | 0.0 /100 | #288 | Tragic 15.1% |
| Immigrants | Belize | 0.0 /100 | #289 | Tragic 15.2% |
| Immigrants | Azores | 0.0 /100 | #290 | Tragic 15.2% |
| Paiute | 0.0 /100 | #291 | Tragic 15.2% |
| Colville | 0.0 /100 | #292 | Tragic 15.2% |
| Apache | 0.0 /100 | #293 | Tragic 15.3% |
| Immigrants | Jamaica | 0.0 /100 | #294 | Tragic 15.3% |
| U.S. Virgin Islanders | 0.0 /100 | #295 | Tragic 15.4% |
| Yuman | 0.0 /100 | #296 | Tragic 15.4% |
| Hondurans | 0.0 /100 | #297 | Tragic 15.4% |
| Natives/Alaskans | 0.0 /100 | #298 | Tragic 15.5% |
| Spanish American Indians | 0.0 /100 | #299 | Tragic 15.5% |
| Bahamians | 0.0 /100 | #300 | Tragic 15.5% |
| Immigrants | Latin America | 0.0 /100 | #301 | Tragic 15.6% |
| West Indians | 0.0 /100 | #302 | Tragic 15.7% |
| Immigrants | Honduras | 0.0 /100 | #303 | Tragic 15.7% |
| Immigrants | Trinidad and Tobago | 0.0 /100 | #304 | Tragic 15.7% |
| Ecuadorians | 0.0 /100 | #305 | Tragic 15.7% |