Austrian vs Immigrants from Uzbekistan Child Poverty Under the Age of 5

COMPARE

Austrian
Race
Ancestry
AfghanAfricanAlaska NativeAlaskan AthabascanAlbanianAleutAlsatianAmericanApacheArabArapahoArgentineanArmenianAssyrian/Chaldean/SyriacAustralianAustrianBahamianBangladeshiBarbadianBasqueBelgianBelizeanBermudanBhutaneseBlackfeetBolivianBrazilianBritishBritish West IndianBulgarianBurmeseCajunCambodianCanadianCape VerdeanCarpatho RusynCelticCentral AmericanCentral American IndianCherokeeCheyenneChickasawChileanChineseChippewaChoctawColombianColvilleComancheCosta RicanCreeCreekCroatianCrowCubanCypriotCzechCzechoslovakianDanishDelawareDominicanDutchDutch West IndianEastern EuropeanEcuadorianEgyptianEnglishEstonianEthiopianEuropeanFijianFilipinoFinnishFrenchFrench American IndianFrench CanadianGermanGerman RussianGhanaianGreekGuamanian/ChamorroGuatemalanGuyaneseHaitianHmongHonduranHopiHoumaHungarianIcelanderIndian (Asian)IndonesianInupiatIranianIraqiIrishIroquoisIsraeliItalianJamaicanJapaneseJordanianKenyanKiowaKoreanLaotianLatvianLebaneseLiberianLithuanianLumbeeLuxembourgerMacedonianMalaysianMalteseMarshalleseMenomineeMexicanMexican American IndianMongolianMoroccanNative HawaiianNavajoNepaleseNew ZealanderNicaraguanNigerianNorthern EuropeanNorwegianOkinawanOsageOttawaPaiutePakistaniPalestinianPanamanianParaguayanPennsylvania GermanPeruvianPimaPolishPortuguesePotawatomiPuebloPuerto RicanPuget Sound SalishRomanianRussianSalvadoranSamoanScandinavianScotch-IrishScottishSeminoleSenegaleseSerbianShoshoneSierra LeoneanSiouxSlavicSlovakSloveneSomaliSouth AfricanSouth AmericanSouth American IndianSoviet UnionSpaniardSpanishSpanish AmericanSpanish American IndianSri LankanSubsaharan AfricanSudaneseSwedishSwissSyrianTaiwaneseThaiTlingit-HaidaTohono O'OdhamTonganTrinidadian and TobagonianTsimshianTurkishU.S. Virgin IslanderUgandanUkrainianUruguayanUteVenezuelanVietnameseWelshWest IndianYakamaYaquiYugoslavianYumanYup'ikZimbabwean
Immigration
NonimmigrantsImmigrantsAfghanistanAfricaAlbaniaArgentinaArmeniaAsiaAustraliaAustriaBahamasBangladeshBarbadosBelarusBelgiumBelizeBoliviaBosnia and HerzegovinaBrazilBulgariaBurma/MyanmarCabo VerdeCambodiaCameroonCanadaCaribbeanCentral AmericaChileChinaColombiaCongoCosta RicaCroatiaCubaCzechoslovakiaDenmarkDominicaDominican RepublicEastern AfricaEastern AsiaEastern EuropeEcuadorEgyptEl SalvadorEnglandEritreaEthiopiaEuropeFijiFranceGermanyGhanaGreeceGrenadaGuatemalaGuyanaHaitiHondurasHong KongHungaryIndiaIndonesiaIranIraqIrelandIsraelItalyJamaicaJapanJordanKazakhstanKenyaKoreaKuwaitLaosLatin AmericaLatviaLebanonLiberiaLithuaniaMalaysiaMexicoMicronesiaMiddle AfricaMoldovaMoroccoNepalNetherlandsNicaraguaNigeriaNorth AmericaNorth MacedoniaNorthern AfricaNorthern EuropeNorwayOceaniaPakistanPanamaPeruPhilippinesPolandPortugalRomaniaRussiaSaudi ArabiaScotlandSenegalSerbiaSierra LeoneSingaporeSomaliaSouth AfricaSouth AmericaSouth Central AsiaSouth Eastern AsiaSouthern EuropeSpainSri LankaSt. Vincent and the GrenadinesSudanSwedenSwitzerlandSyriaTaiwanThailandTrinidad and TobagoTurkeyUgandaUkraineUruguayVenezuelaVietnamWest IndiesWestern AfricaWestern AsiaWestern EuropeYemenZaireZimbabweAzores
Immigrants from Uzbekistan
Race
Ancestry
AfghanAfricanAlaska NativeAlaskan AthabascanAlbanianAleutAlsatianAmericanApacheArabArapahoArgentineanArmenianAssyrian/Chaldean/SyriacAustralianBahamianBangladeshiBarbadianBasqueBelgianBelizeanBermudanBhutaneseBlackfeetBolivianBrazilianBritishBritish West IndianBulgarianBurmeseCajunCambodianCanadianCape VerdeanCarpatho RusynCelticCentral AmericanCentral American IndianCherokeeCheyenneChickasawChileanChineseChippewaChoctawColombianColvilleComancheCosta RicanCreeCreekCroatianCrowCubanCypriotCzechCzechoslovakianDanishDelawareDominicanDutchDutch West IndianEastern EuropeanEcuadorianEgyptianEnglishEstonianEthiopianEuropeanFijianFilipinoFinnishFrenchFrench American IndianFrench CanadianGermanGerman RussianGhanaianGreekGuamanian/ChamorroGuatemalanGuyaneseHaitianHmongHonduranHopiHoumaHungarianIcelanderIndian (Asian)IndonesianInupiatIranianIraqiIrishIroquoisIsraeliItalianJamaicanJapaneseJordanianKenyanKiowaKoreanLaotianLatvianLebaneseLiberianLithuanianLumbeeLuxembourgerMacedonianMalaysianMalteseMarshalleseMenomineeMexicanMexican American IndianMongolianMoroccanNative HawaiianNavajoNepaleseNew ZealanderNicaraguanNigerianNorthern EuropeanNorwegianOkinawanOsageOttawaPaiutePakistaniPalestinianPanamanianParaguayanPennsylvania GermanPeruvianPimaPolishPortuguesePotawatomiPuebloPuerto RicanPuget Sound SalishRomanianRussianSalvadoranSamoanScandinavianScotch-IrishScottishSeminoleSenegaleseSerbianShoshoneSierra LeoneanSiouxSlavicSlovakSloveneSomaliSouth AfricanSouth AmericanSouth American IndianSoviet UnionSpaniardSpanishSpanish AmericanSpanish American IndianSri LankanSubsaharan AfricanSudaneseSwedishSwissSyrianTaiwaneseThaiTlingit-HaidaTohono O'OdhamTonganTrinidadian and TobagonianTsimshianTurkishU.S. Virgin IslanderUgandanUkrainianUruguayanUteVenezuelanVietnameseWelshWest IndianYakamaYaquiYugoslavianYumanYup'ikZimbabwean
Immigration
NonimmigrantsImmigrantsAfghanistanAfricaAlbaniaArgentinaArmeniaAsiaAustraliaAustriaBahamasBangladeshBarbadosBelarusBelgiumBelizeBoliviaBosnia and HerzegovinaBrazilBulgariaBurma/MyanmarCabo VerdeCambodiaCameroonCanadaCaribbeanCentral AmericaChileChinaColombiaCongoCosta RicaCroatiaCubaCzechoslovakiaDenmarkDominicaDominican RepublicEastern AfricaEastern AsiaEastern EuropeEcuadorEgyptEl SalvadorEnglandEritreaEthiopiaEuropeFijiFranceGermanyGhanaGreeceGrenadaGuatemalaGuyanaHaitiHondurasHong KongHungaryIndiaIndonesiaIranIraqIrelandIsraelItalyJamaicaJapanJordanKazakhstanKenyaKoreaKuwaitLaosLatin AmericaLatviaLebanonLiberiaLithuaniaMalaysiaMexicoMicronesiaMiddle AfricaMoldovaMoroccoNepalNetherlandsNicaraguaNigeriaNorth AmericaNorth MacedoniaNorthern AfricaNorthern EuropeNorwayOceaniaPakistanPanamaPeruPhilippinesPolandPortugalRomaniaRussiaSaudi ArabiaScotlandSenegalSerbiaSierra LeoneSingaporeSomaliaSouth AfricaSouth AmericaSouth Central AsiaSouth Eastern AsiaSouthern EuropeSpainSri LankaSt. Vincent and the GrenadinesSudanSwedenSwitzerlandSyriaTaiwanThailandTrinidad and TobagoTurkeyUgandaUkraineUruguayUzbekistanVenezuelaVietnamWest IndiesWestern AfricaWestern AsiaWestern EuropeYemenZaireZimbabweAzores
Child Poverty Under the Age of 5
Income
Poverty
Unemployment
Labor Participation
Family Structure
Vehicle Availability
Education Level
Disability

Child Poverty Under the Age of 5 Comparison

Austrians

Immigrants from Uzbekistan

Exceptional
Good
16.1%
CHILD POVERTY UNDER THE AGE OF 5
92.0/ 100
METRIC RATING
123rd/ 347
METRIC RANK
17.0%
CHILD POVERTY UNDER THE AGE OF 5
62.0/ 100
METRIC RATING
167th/ 347
METRIC RANK

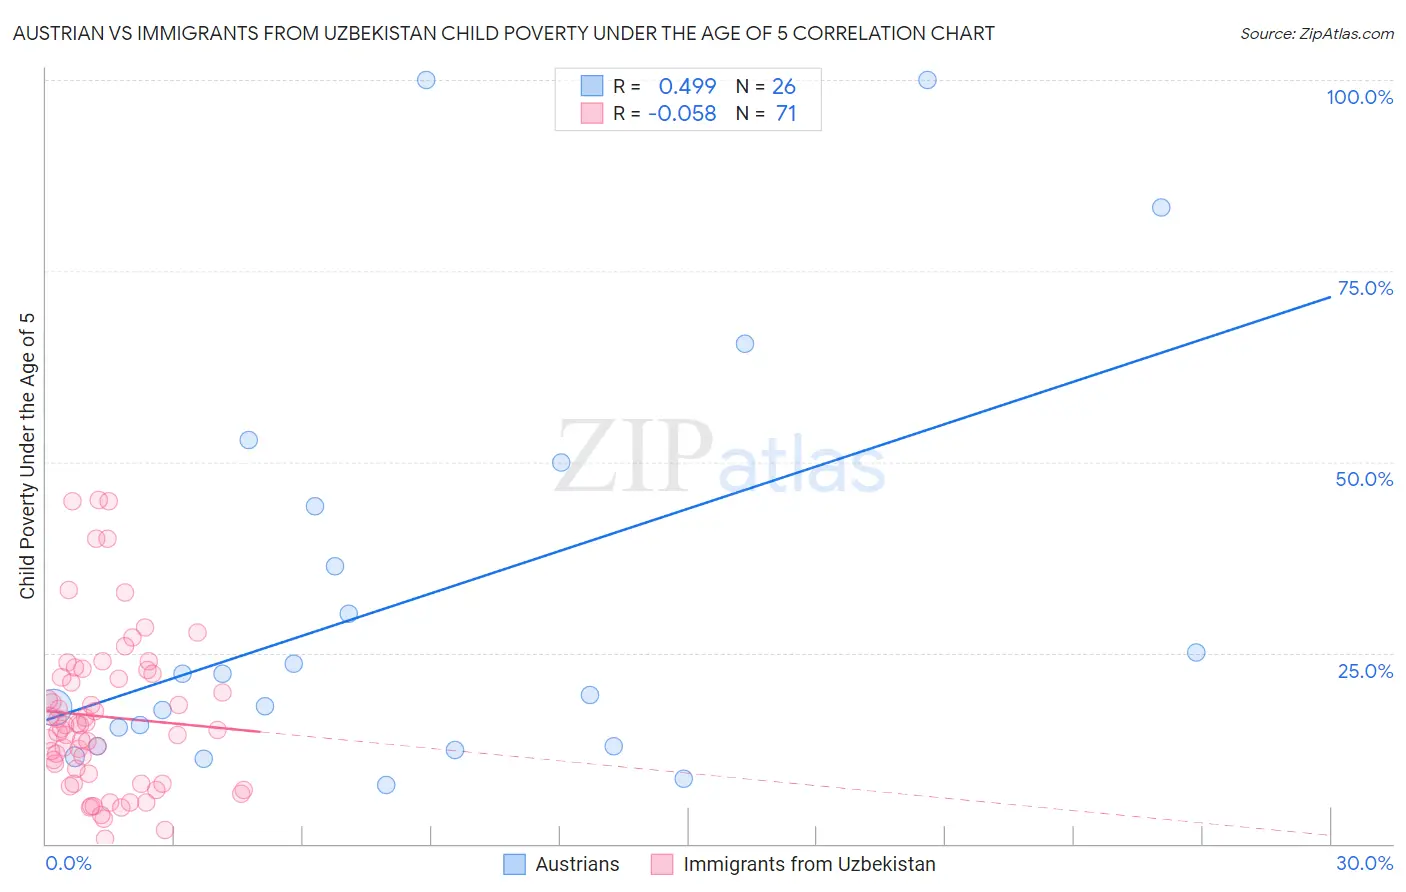
Austrian vs Immigrants from Uzbekistan Child Poverty Under the Age of 5 Correlation Chart

The statistical analysis conducted on geographies consisting of 426,879,815 people shows a moderate positive correlation between the proportion of Austrians and poverty level among children under the age of 5 in the United States with a correlation coefficient (R) of 0.499 and weighted average of 16.1%. Similarly, the statistical analysis conducted on geographies consisting of 116,390,031 people shows a slight negative correlation between the proportion of Immigrants from Uzbekistan and poverty level among children under the age of 5 in the United States with a correlation coefficient (R) of -0.058 and weighted average of 17.0%, a difference of 5.4%.
Austrian vs Immigrants from Uzbekistan Child Poverty Under the Age of 5

Child Poverty Under the Age of 5 Correlation Summary

MeasurementAustrianImmigrants from Uzbekistan
Minimum7.7%0.67%
Maximum100.0%44.9%
Range92.3%44.3%
Mean32.1%16.6%
Median20.8%15.0%
Interquartile 25% (IQ1)12.8%7.9%
Interquartile 75% (IQ3)44.1%22.3%
Interquartile Range (IQR)31.3%14.4%
Standard Deviation (Sample)27.3%10.4%
Standard Deviation (Population)26.8%10.3%

Similar Demographics by Child Poverty Under the Age of 5

Demographics Similar to Austrians by Child Poverty Under the Age of 5

In terms of child poverty under the age of 5, the demographic groups most similar to Austrians are Swiss (16.1%, a difference of 0.010%), Immigrants from Southern Europe (16.1%, a difference of 0.030%), Native Hawaiian (16.2%, a difference of 0.080%), Immigrants from Albania (16.2%, a difference of 0.080%), and Immigrants from England (16.2%, a difference of 0.17%).
DemographicsRating | RankChild Poverty Under the Age of 5
Immigrants | Austria
93.5
/100
|
#116
Exceptional
16.0%
Basques
93.4
/100
|
#117
Exceptional
16.0%
Immigrants | Denmark
93.4
/100
|
#118
Exceptional
16.0%
Immigrants | Jordan
93.2
/100
|
#119
Exceptional
16.1%
Immigrants | Peru
92.6
/100
|
#120
Exceptional
16.1%
Mongolians
92.5
/100
|
#121
Exceptional
16.1%
Immigrants | Southern Europe
92.0
/100
|
#122
Exceptional
16.1%
Austrians
92.0
/100
|
#123
Exceptional
16.1%
Swiss
92.0
/100
|
#124
Exceptional
16.1%
Native Hawaiians
91.8
/100
|
#125
Exceptional
16.2%
Immigrants | Albania
91.8
/100
|
#126
Exceptional
16.2%
Immigrants | England
91.5
/100
|
#127
Exceptional
16.2%
South Africans
90.1
/100
|
#128
Exceptional
16.2%
British
89.4
/100
|
#129
Excellent
16.3%
Immigrants | Norway
89.3
/100
|
#130
Excellent
16.3%

Demographics Similar to Immigrants from Uzbekistan by Child Poverty Under the Age of 5

In terms of child poverty under the age of 5, the demographic groups most similar to Immigrants from Uzbekistan are Uruguayan (17.0%, a difference of 0.16%), Immigrants from South America (17.1%, a difference of 0.21%), Slavic (17.0%, a difference of 0.22%), Immigrants from Western Asia (17.1%, a difference of 0.30%), and Immigrants from Morocco (17.1%, a difference of 0.33%).
DemographicsRating | RankChild Poverty Under the Age of 5
Irish
72.0
/100
|
#160
Good
16.8%
English
70.4
/100
|
#161
Good
16.8%
Costa Ricans
69.8
/100
|
#162
Good
16.9%
Scottish
68.6
/100
|
#163
Good
16.9%
Immigrants | Oceania
67.6
/100
|
#164
Good
16.9%
Immigrants | Colombia
66.9
/100
|
#165
Good
16.9%
Slavs
64.0
/100
|
#166
Good
17.0%
Immigrants | Uzbekistan
62.0
/100
|
#167
Good
17.0%
Uruguayans
60.5
/100
|
#168
Good
17.0%
Immigrants | South America
60.0
/100
|
#169
Good
17.1%
Immigrants | Western Asia
59.2
/100
|
#170
Average
17.1%
Immigrants | Morocco
58.9
/100
|
#171
Average
17.1%
Yugoslavians
54.1
/100
|
#172
Average
17.2%
Welsh
54.0
/100
|
#173
Average
17.2%
Immigrants | Saudi Arabia
50.0
/100
|
#174
Average
17.2%