Austrian vs Immigrants from Ireland Child Poverty Under the Age of 16

COMPARE

Austrian
Race
Ancestry
AfghanAfricanAlaska NativeAlaskan AthabascanAlbanianAleutAlsatianAmericanApacheArabArapahoArgentineanArmenianAssyrian/Chaldean/SyriacAustralianAustrianBahamianBangladeshiBarbadianBasqueBelgianBelizeanBermudanBhutaneseBlackfeetBolivianBrazilianBritishBritish West IndianBulgarianBurmeseCajunCambodianCanadianCape VerdeanCarpatho RusynCelticCentral AmericanCentral American IndianCherokeeCheyenneChickasawChileanChineseChippewaChoctawColombianColvilleComancheCosta RicanCreeCreekCroatianCrowCubanCypriotCzechCzechoslovakianDanishDelawareDominicanDutchDutch West IndianEastern EuropeanEcuadorianEgyptianEnglishEstonianEthiopianEuropeanFijianFilipinoFinnishFrenchFrench American IndianFrench CanadianGermanGerman RussianGhanaianGreekGuamanian/ChamorroGuatemalanGuyaneseHaitianHmongHonduranHopiHoumaHungarianIcelanderIndian (Asian)IndonesianInupiatIranianIraqiIrishIroquoisIsraeliItalianJamaicanJapaneseJordanianKenyanKiowaKoreanLaotianLatvianLebaneseLiberianLithuanianLumbeeLuxembourgerMacedonianMalaysianMalteseMarshalleseMenomineeMexicanMexican American IndianMongolianMoroccanNative HawaiianNavajoNepaleseNew ZealanderNicaraguanNigerianNorthern EuropeanNorwegianOkinawanOsageOttawaPaiutePakistaniPalestinianPanamanianParaguayanPennsylvania GermanPeruvianPimaPolishPortuguesePotawatomiPuebloPuerto RicanPuget Sound SalishRomanianRussianSalvadoranSamoanScandinavianScotch-IrishScottishSeminoleSenegaleseSerbianShoshoneSierra LeoneanSiouxSlavicSlovakSloveneSomaliSouth AfricanSouth AmericanSouth American IndianSoviet UnionSpaniardSpanishSpanish AmericanSpanish American IndianSri LankanSubsaharan AfricanSudaneseSwedishSwissSyrianTaiwaneseThaiTlingit-HaidaTohono O'OdhamTonganTrinidadian and TobagonianTsimshianTurkishU.S. Virgin IslanderUgandanUkrainianUruguayanUteVenezuelanVietnameseWelshWest IndianYakamaYaquiYugoslavianYumanYup'ikZimbabwean
Immigration
NonimmigrantsImmigrantsAfghanistanAfricaAlbaniaArgentinaArmeniaAsiaAustraliaAustriaBahamasBangladeshBarbadosBelarusBelgiumBelizeBoliviaBosnia and HerzegovinaBrazilBulgariaBurma/MyanmarCabo VerdeCambodiaCameroonCanadaCaribbeanCentral AmericaChileChinaColombiaCongoCosta RicaCroatiaCubaCzechoslovakiaDenmarkDominicaDominican RepublicEastern AfricaEastern AsiaEastern EuropeEcuadorEgyptEl SalvadorEnglandEritreaEthiopiaEuropeFijiFranceGermanyGhanaGreeceGrenadaGuatemalaGuyanaHaitiHondurasHong KongHungaryIndiaIndonesiaIranIraqIsraelItalyJamaicaJapanJordanKazakhstanKenyaKoreaKuwaitLaosLatin AmericaLatviaLebanonLiberiaLithuaniaMalaysiaMexicoMicronesiaMiddle AfricaMoldovaMoroccoNepalNetherlandsNicaraguaNigeriaNorth AmericaNorth MacedoniaNorthern AfricaNorthern EuropeNorwayOceaniaPakistanPanamaPeruPhilippinesPolandPortugalRomaniaRussiaSaudi ArabiaScotlandSenegalSerbiaSierra LeoneSingaporeSomaliaSouth AfricaSouth AmericaSouth Central AsiaSouth Eastern AsiaSouthern EuropeSpainSri LankaSt. Vincent and the GrenadinesSudanSwedenSwitzerlandSyriaTaiwanThailandTrinidad and TobagoTurkeyUgandaUkraineUruguayUzbekistanVenezuelaVietnamWest IndiesWestern AfricaWestern AsiaWestern EuropeYemenZaireZimbabweAzores
Immigrants from Ireland
Race
Ancestry
AfghanAfricanAlaska NativeAlaskan AthabascanAlbanianAleutAlsatianAmericanApacheArabArapahoArgentineanArmenianAssyrian/Chaldean/SyriacAustralianBahamianBangladeshiBarbadianBasqueBelgianBelizeanBermudanBhutaneseBlackfeetBolivianBrazilianBritishBritish West IndianBulgarianBurmeseCajunCambodianCanadianCape VerdeanCarpatho RusynCelticCentral AmericanCentral American IndianCherokeeCheyenneChickasawChileanChineseChippewaChoctawColombianColvilleComancheCosta RicanCreeCreekCroatianCrowCubanCypriotCzechCzechoslovakianDanishDelawareDominicanDutchDutch West IndianEastern EuropeanEcuadorianEgyptianEnglishEstonianEthiopianEuropeanFijianFilipinoFinnishFrenchFrench American IndianFrench CanadianGermanGerman RussianGhanaianGreekGuamanian/ChamorroGuatemalanGuyaneseHaitianHmongHonduranHopiHoumaHungarianIcelanderIndian (Asian)IndonesianInupiatIranianIraqiIrishIroquoisIsraeliItalianJamaicanJapaneseJordanianKenyanKiowaKoreanLaotianLatvianLebaneseLiberianLithuanianLumbeeLuxembourgerMacedonianMalaysianMalteseMarshalleseMenomineeMexicanMexican American IndianMongolianMoroccanNative HawaiianNavajoNepaleseNew ZealanderNicaraguanNigerianNorthern EuropeanNorwegianOkinawanOsageOttawaPaiutePakistaniPalestinianPanamanianParaguayanPennsylvania GermanPeruvianPimaPolishPortuguesePotawatomiPuebloPuerto RicanPuget Sound SalishRomanianRussianSalvadoranSamoanScandinavianScotch-IrishScottishSeminoleSenegaleseSerbianShoshoneSierra LeoneanSiouxSlavicSlovakSloveneSomaliSouth AfricanSouth AmericanSouth American IndianSoviet UnionSpaniardSpanishSpanish AmericanSpanish American IndianSri LankanSubsaharan AfricanSudaneseSwedishSwissSyrianTaiwaneseThaiTlingit-HaidaTohono O'OdhamTonganTrinidadian and TobagonianTsimshianTurkishU.S. Virgin IslanderUgandanUkrainianUruguayanUteVenezuelanVietnameseWelshWest IndianYakamaYaquiYugoslavianYumanYup'ikZimbabwean
Immigration
NonimmigrantsImmigrantsAfghanistanAfricaAlbaniaArgentinaArmeniaAsiaAustraliaAustriaBahamasBangladeshBarbadosBelarusBelgiumBelizeBoliviaBosnia and HerzegovinaBrazilBulgariaBurma/MyanmarCabo VerdeCambodiaCameroonCanadaCaribbeanCentral AmericaChileChinaColombiaCongoCosta RicaCroatiaCubaCzechoslovakiaDenmarkDominicaDominican RepublicEastern AfricaEastern AsiaEastern EuropeEcuadorEgyptEl SalvadorEnglandEritreaEthiopiaEuropeFijiFranceGermanyGhanaGreeceGrenadaGuatemalaGuyanaHaitiHondurasHong KongHungaryIndiaIndonesiaIranIraqIrelandIsraelItalyJamaicaJapanJordanKazakhstanKenyaKoreaKuwaitLaosLatin AmericaLatviaLebanonLiberiaLithuaniaMalaysiaMexicoMicronesiaMiddle AfricaMoldovaMoroccoNepalNetherlandsNicaraguaNigeriaNorth AmericaNorth MacedoniaNorthern AfricaNorthern EuropeNorwayOceaniaPakistanPanamaPeruPhilippinesPolandPortugalRomaniaRussiaSaudi ArabiaScotlandSenegalSerbiaSierra LeoneSingaporeSomaliaSouth AfricaSouth AmericaSouth Central AsiaSouth Eastern AsiaSouthern EuropeSpainSri LankaSt. Vincent and the GrenadinesSudanSwedenSwitzerlandSyriaTaiwanThailandTrinidad and TobagoTurkeyUgandaUkraineUruguayUzbekistanVenezuelaVietnamWest IndiesWestern AfricaWestern AsiaWestern EuropeYemenZaireZimbabweAzores
Child Poverty Under the Age of 16
Income
Poverty
Unemployment
Labor Participation
Family Structure
Vehicle Availability
Education Level
Disability

Child Poverty Under the Age of 16 Comparison

Austrians

Immigrants from Ireland

Exceptional
Exceptional
14.5%
CHILD POVERTY UNDER THE AGE OF 16
96.9/ 100
METRIC RATING
90th/ 347
METRIC RANK
12.7%
CHILD POVERTY UNDER THE AGE OF 16
99.9/ 100
METRIC RATING
12th/ 347
METRIC RANK

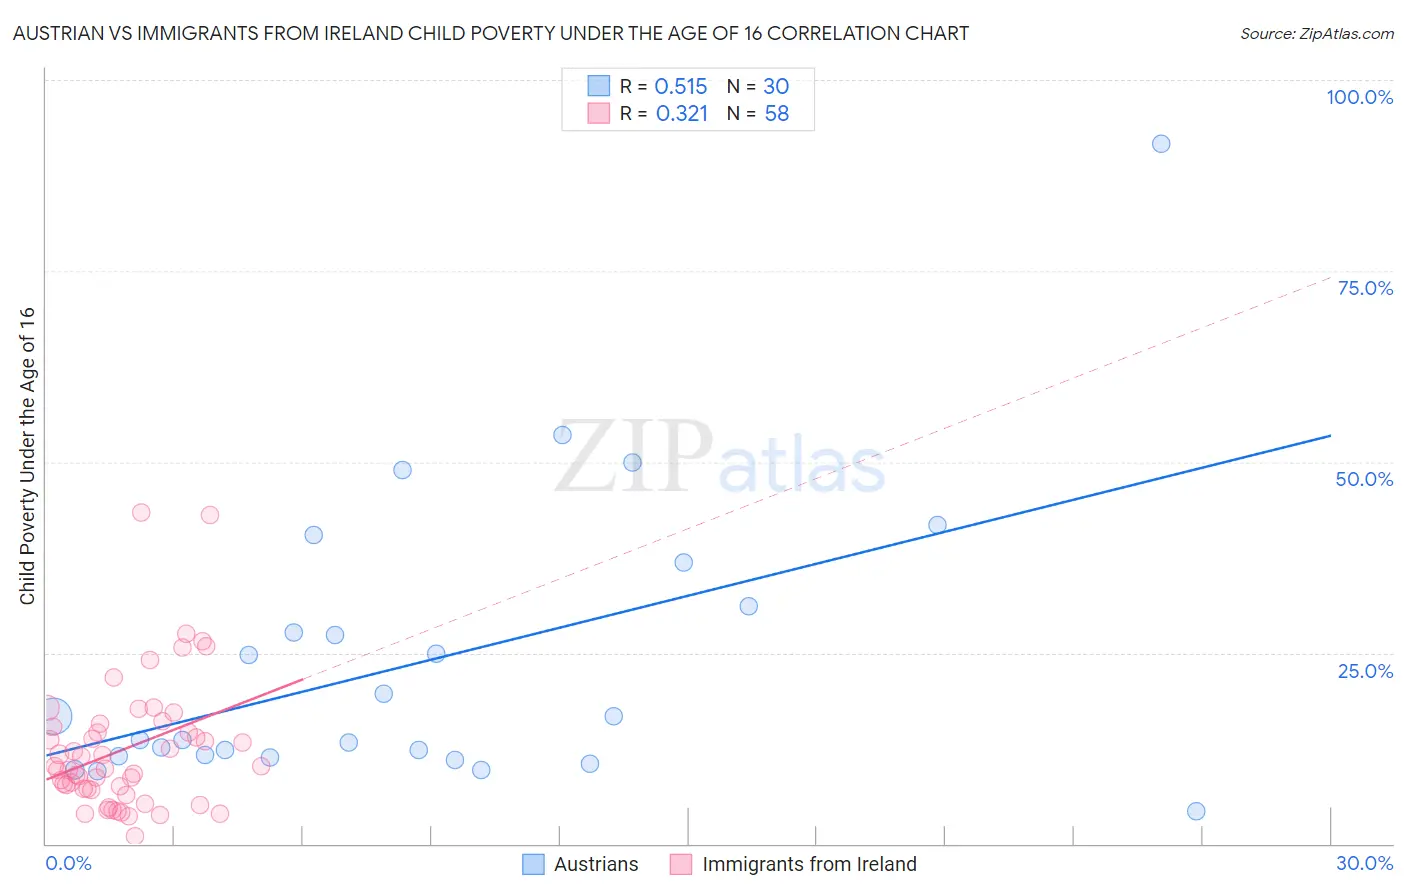
Austrian vs Immigrants from Ireland Child Poverty Under the Age of 16 Correlation Chart

The statistical analysis conducted on geographies consisting of 445,410,621 people shows a substantial positive correlation between the proportion of Austrians and poverty level among children under the age of 16 in the United States with a correlation coefficient (R) of 0.515 and weighted average of 14.5%. Similarly, the statistical analysis conducted on geographies consisting of 238,601,869 people shows a mild positive correlation between the proportion of Immigrants from Ireland and poverty level among children under the age of 16 in the United States with a correlation coefficient (R) of 0.321 and weighted average of 12.7%, a difference of 14.7%.
Austrian vs Immigrants from Ireland Child Poverty Under the Age of 16

Child Poverty Under the Age of 16 Correlation Summary

MeasurementAustrianImmigrants from Ireland
Minimum4.3%0.95%
Maximum91.7%43.3%
Range87.4%42.4%
Mean23.9%12.4%
Median15.1%9.9%
Interquartile 25% (IQ1)11.5%7.2%
Interquartile 75% (IQ3)31.1%15.3%
Interquartile Range (IQR)19.6%8.1%
Standard Deviation (Sample)18.8%8.6%
Standard Deviation (Population)18.5%8.5%

Similar Demographics by Child Poverty Under the Age of 16

Demographics Similar to Austrians by Child Poverty Under the Age of 16

In terms of child poverty under the age of 16, the demographic groups most similar to Austrians are German (14.5%, a difference of 0.060%), Northern European (14.5%, a difference of 0.12%), Immigrants from North America (14.6%, a difference of 0.18%), Immigrants from Italy (14.6%, a difference of 0.21%), and Immigrants from Argentina (14.5%, a difference of 0.22%).
DemographicsRating | RankChild Poverty Under the Age of 16
Egyptians
97.2
/100
|
#83
Exceptional
14.5%
Immigrants | Latvia
97.1
/100
|
#84
Exceptional
14.5%
Soviet Union
97.1
/100
|
#85
Exceptional
14.5%
Immigrants | Argentina
97.1
/100
|
#86
Exceptional
14.5%
Taiwanese
97.1
/100
|
#87
Exceptional
14.5%
Northern Europeans
97.0
/100
|
#88
Exceptional
14.5%
Germans
96.9
/100
|
#89
Exceptional
14.5%
Austrians
96.9
/100
|
#90
Exceptional
14.5%
Immigrants | North America
96.7
/100
|
#91
Exceptional
14.6%
Immigrants | Italy
96.7
/100
|
#92
Exceptional
14.6%
Argentineans
96.6
/100
|
#93
Exceptional
14.6%
Immigrants | South Africa
96.3
/100
|
#94
Exceptional
14.6%
Immigrants | Croatia
96.1
/100
|
#95
Exceptional
14.6%
Immigrants | France
95.8
/100
|
#96
Exceptional
14.7%
Paraguayans
95.7
/100
|
#97
Exceptional
14.7%

Demographics Similar to Immigrants from Ireland by Child Poverty Under the Age of 16

In terms of child poverty under the age of 16, the demographic groups most similar to Immigrants from Ireland are Burmese (12.8%, a difference of 1.1%), Bhutanese (12.5%, a difference of 1.1%), Immigrants from South Central Asia (12.5%, a difference of 1.1%), Immigrants from Lithuania (12.9%, a difference of 1.9%), and Immigrants from Korea (13.0%, a difference of 2.3%).
DemographicsRating | RankChild Poverty Under the Age of 16
Chinese
100.0
/100
|
#5
Exceptional
11.9%
Immigrants | Hong Kong
100.0
/100
|
#6
Exceptional
12.1%
Iranians
100.0
/100
|
#7
Exceptional
12.2%
Immigrants | Singapore
100.0
/100
|
#8
Exceptional
12.4%
Immigrants | Iran
100.0
/100
|
#9
Exceptional
12.4%
Immigrants | South Central Asia
99.9
/100
|
#10
Exceptional
12.5%
Bhutanese
99.9
/100
|
#11
Exceptional
12.5%
Immigrants | Ireland
99.9
/100
|
#12
Exceptional
12.7%
Burmese
99.9
/100
|
#13
Exceptional
12.8%
Immigrants | Lithuania
99.9
/100
|
#14
Exceptional
12.9%
Immigrants | Korea
99.9
/100
|
#15
Exceptional
13.0%
Norwegians
99.9
/100
|
#16
Exceptional
13.0%
Bulgarians
99.9
/100
|
#17
Exceptional
13.0%
Cypriots
99.9
/100
|
#18
Exceptional
13.0%
Immigrants | Japan
99.8
/100
|
#19
Exceptional
13.0%