Austrian vs Immigrants from Afghanistan Single Female Poverty
COMPARE
Austrian
Immigrants from Afghanistan
Single Female Poverty
Single Female Poverty Comparison
Austrians
Immigrants from Afghanistan
20.4%
SINGLE FEMALE POVERTY
85.8/ 100
METRIC RATING
145th/ 347
METRIC RANK
20.0%
SINGLE FEMALE POVERTY
95.4/ 100
METRIC RATING
118th/ 347
METRIC RANK
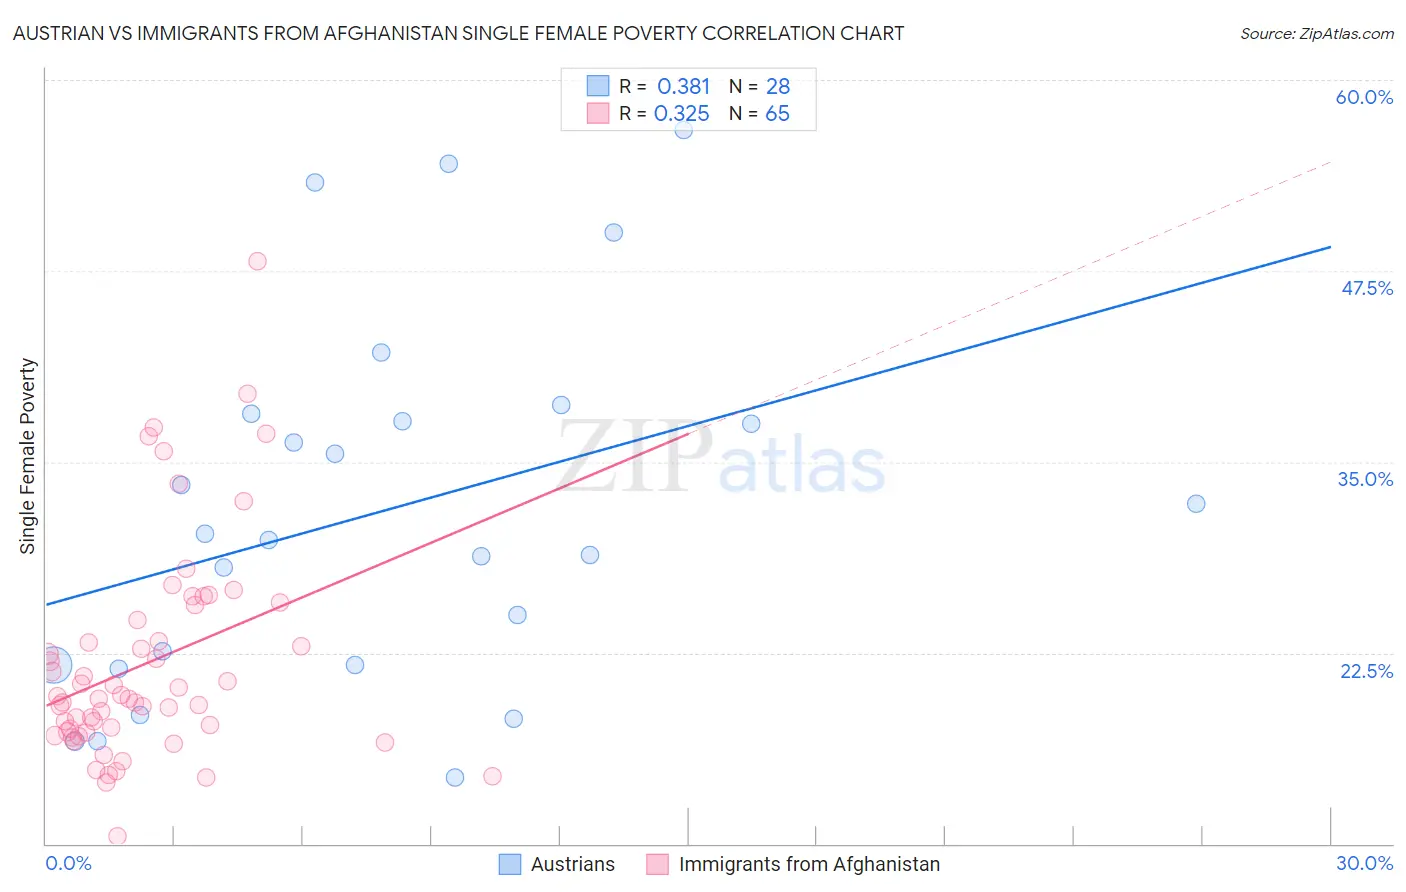
Austrian vs Immigrants from Afghanistan Single Female Poverty Correlation Chart
The statistical analysis conducted on geographies consisting of 441,015,533 people shows a mild positive correlation between the proportion of Austrians and poverty level among single females in the United States with a correlation coefficient (R) of 0.381 and weighted average of 20.4%. Similarly, the statistical analysis conducted on geographies consisting of 146,836,819 people shows a mild positive correlation between the proportion of Immigrants from Afghanistan and poverty level among single females in the United States with a correlation coefficient (R) of 0.325 and weighted average of 20.0%, a difference of 2.0%.
Single Female Poverty Correlation Summary
| Measurement | Austrian | Immigrants from Afghanistan |
| Minimum | 14.3% | 10.5% |
| Maximum | 56.8% | 48.1% |
| Range | 42.4% | 37.7% |
| Mean | 31.8% | 21.8% |
| Median | 30.1% | 19.5% |
| Interquartile 25% (IQ1) | 21.7% | 17.3% |
| Interquartile 75% (IQ3) | 37.9% | 25.1% |
| Interquartile Range (IQR) | 16.2% | 7.8% |
| Standard Deviation (Sample) | 11.9% | 7.1% |
| Standard Deviation (Population) | 11.7% | 7.0% |
Similar Demographics by Single Female Poverty
Demographics Similar to Austrians by Single Female Poverty
In terms of single female poverty, the demographic groups most similar to Austrians are Venezuelan (20.4%, a difference of 0.030%), South African (20.4%, a difference of 0.060%), Luxembourger (20.4%, a difference of 0.11%), Immigrants from Uzbekistan (20.3%, a difference of 0.36%), and Australian (20.3%, a difference of 0.37%).
| Demographics | Rating | Rank | Single Female Poverty |
| Slovenes | 90.5 /100 | #138 | Exceptional 20.3% |
| Immigrants | Kuwait | 90.4 /100 | #139 | Exceptional 20.3% |
| Syrians | 90.4 /100 | #140 | Exceptional 20.3% |
| Immigrants | North America | 89.5 /100 | #141 | Excellent 20.3% |
| Immigrants | Uganda | 89.1 /100 | #142 | Excellent 20.3% |
| Australians | 88.4 /100 | #143 | Excellent 20.3% |
| Immigrants | Uzbekistan | 88.3 /100 | #144 | Excellent 20.3% |
| Austrians | 85.8 /100 | #145 | Excellent 20.4% |
| Venezuelans | 85.5 /100 | #146 | Excellent 20.4% |
| South Africans | 85.3 /100 | #147 | Excellent 20.4% |
| Luxembourgers | 84.9 /100 | #148 | Excellent 20.4% |
| Portuguese | 81.5 /100 | #149 | Excellent 20.5% |
| Immigrants | Denmark | 80.5 /100 | #150 | Excellent 20.5% |
| Puget Sound Salish | 79.6 /100 | #151 | Good 20.6% |
| Immigrants | Uruguay | 77.7 /100 | #152 | Good 20.6% |
Demographics Similar to Immigrants from Afghanistan by Single Female Poverty
In terms of single female poverty, the demographic groups most similar to Immigrants from Afghanistan are Immigrants from Ethiopia (20.0%, a difference of 0.0%), Polish (20.0%, a difference of 0.080%), South American (20.0%, a difference of 0.10%), Immigrants from Kazakhstan (20.0%, a difference of 0.12%), and Immigrants from Switzerland (20.0%, a difference of 0.13%).
| Demographics | Rating | Rank | Single Female Poverty |
| Carpatho Rusyns | 96.1 /100 | #111 | Exceptional 20.0% |
| Immigrants | Netherlands | 96.0 /100 | #112 | Exceptional 20.0% |
| Immigrants | Zimbabwe | 95.9 /100 | #113 | Exceptional 20.0% |
| Immigrants | Colombia | 95.9 /100 | #114 | Exceptional 20.0% |
| Immigrants | Northern Africa | 95.8 /100 | #115 | Exceptional 20.0% |
| Immigrants | Kazakhstan | 95.7 /100 | #116 | Exceptional 20.0% |
| Poles | 95.6 /100 | #117 | Exceptional 20.0% |
| Immigrants | Afghanistan | 95.4 /100 | #118 | Exceptional 20.0% |
| Immigrants | Ethiopia | 95.4 /100 | #119 | Exceptional 20.0% |
| South Americans | 95.1 /100 | #120 | Exceptional 20.0% |
| Immigrants | Switzerland | 95.1 /100 | #121 | Exceptional 20.0% |
| Immigrants | South America | 95.0 /100 | #122 | Exceptional 20.0% |
| Brazilians | 94.4 /100 | #123 | Exceptional 20.1% |
| Immigrants | Chile | 94.3 /100 | #124 | Exceptional 20.1% |
| Immigrants | South Africa | 93.9 /100 | #125 | Exceptional 20.1% |