Australian vs Jordanian Seniors Poverty Over the Age of 75
COMPARE
Australian
Jordanian
Seniors Poverty Over the Age of 75
Seniors Poverty Over the Age of 75 Comparison
Australians
Jordanians
11.5%
SENIORS POVERTY OVER THE AGE OF 75
94.6/ 100
METRIC RATING
86th/ 347
METRIC RANK
11.6%
SENIORS POVERTY OVER THE AGE OF 75
90.8/ 100
METRIC RATING
101st/ 347
METRIC RANK
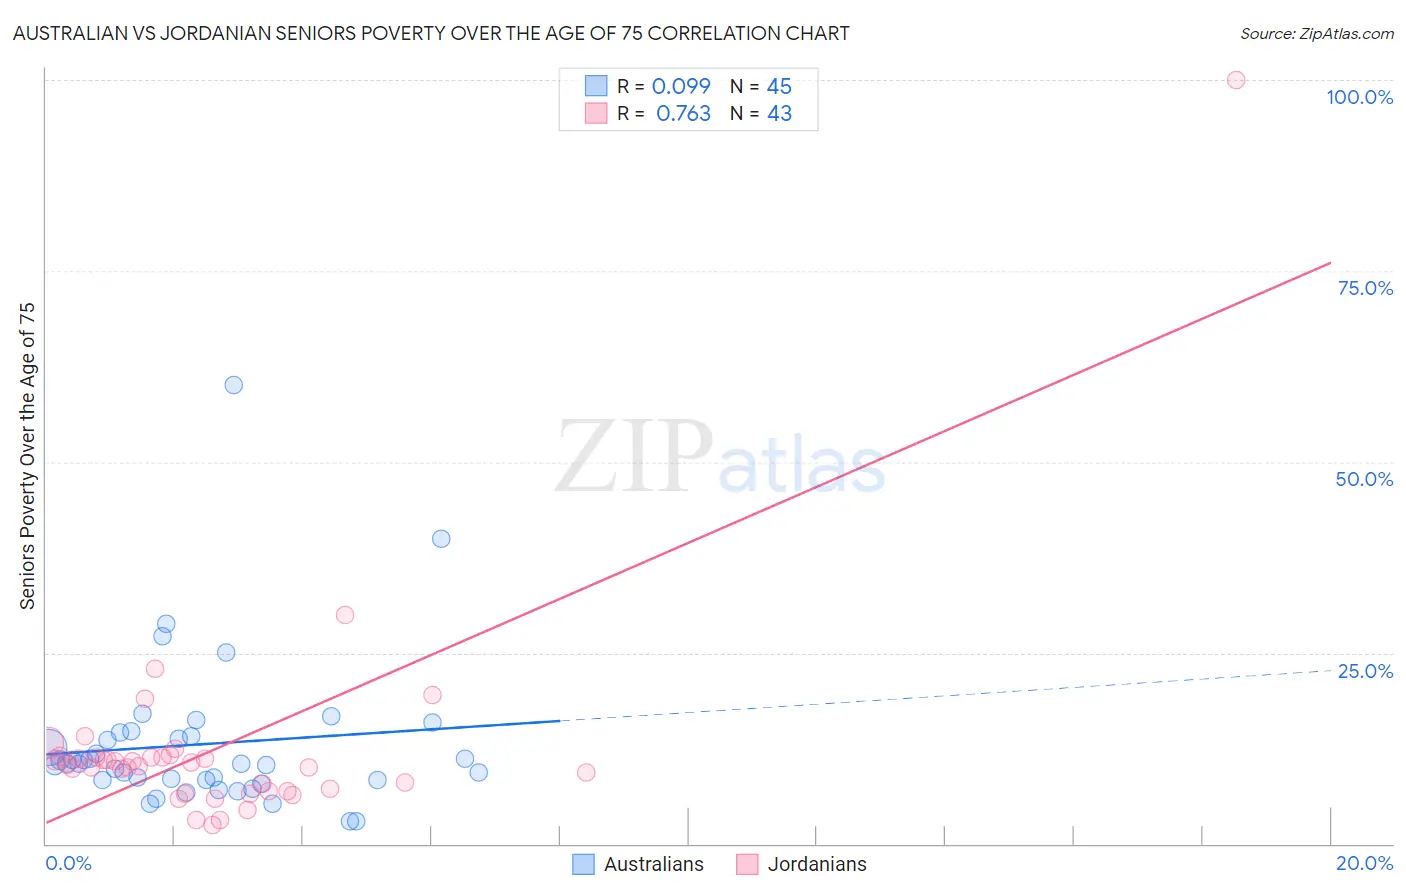
Australian vs Jordanian Seniors Poverty Over the Age of 75 Correlation Chart
The statistical analysis conducted on geographies consisting of 222,582,409 people shows a slight positive correlation between the proportion of Australians and poverty level among seniors over the age of 75 in the United States with a correlation coefficient (R) of 0.099 and weighted average of 11.5%. Similarly, the statistical analysis conducted on geographies consisting of 165,896,130 people shows a strong positive correlation between the proportion of Jordanians and poverty level among seniors over the age of 75 in the United States with a correlation coefficient (R) of 0.763 and weighted average of 11.6%, a difference of 1.2%.
Seniors Poverty Over the Age of 75 Correlation Summary
| Measurement | Australian | Jordanian |
| Minimum | 2.9% | 2.4% |
| Maximum | 60.0% | 100.0% |
| Range | 57.1% | 97.6% |
| Mean | 13.0% | 12.5% |
| Median | 10.5% | 10.4% |
| Interquartile 25% (IQ1) | 8.3% | 6.9% |
| Interquartile 75% (IQ3) | 14.3% | 11.3% |
| Interquartile Range (IQR) | 6.0% | 4.4% |
| Standard Deviation (Sample) | 9.9% | 14.6% |
| Standard Deviation (Population) | 9.8% | 14.4% |
Demographics Similar to Australians and Jordanians by Seniors Poverty Over the Age of 75
In terms of seniors poverty over the age of 75, the demographic groups most similar to Australians are Immigrants from Bulgaria (11.5%, a difference of 0.020%), Korean (11.5%, a difference of 0.030%), Immigrants from Croatia (11.5%, a difference of 0.050%), Immigrants from Sri Lanka (11.5%, a difference of 0.080%), and Immigrants from Iraq (11.5%, a difference of 0.12%). Similarly, the demographic groups most similar to Jordanians are Guamanian/Chamorro (11.6%, a difference of 0.040%), Syrian (11.6%, a difference of 0.080%), Immigrants from Kuwait (11.6%, a difference of 0.080%), Immigrants from Ethiopia (11.6%, a difference of 0.24%), and Immigrants from Japan (11.6%, a difference of 0.31%).
| Demographics | Rating | Rank | Seniors Poverty Over the Age of 75 |
| Immigrants | South Africa | 94.9 /100 | #83 | Exceptional 11.5% |
| Immigrants | Iraq | 94.9 /100 | #84 | Exceptional 11.5% |
| Immigrants | Bulgaria | 94.7 /100 | #85 | Exceptional 11.5% |
| Australians | 94.6 /100 | #86 | Exceptional 11.5% |
| Koreans | 94.5 /100 | #87 | Exceptional 11.5% |
| Immigrants | Croatia | 94.5 /100 | #88 | Exceptional 11.5% |
| Immigrants | Sri Lanka | 94.4 /100 | #89 | Exceptional 11.5% |
| Aleuts | 94.1 /100 | #90 | Exceptional 11.5% |
| Immigrants | Germany | 94.1 /100 | #91 | Exceptional 11.5% |
| Kenyans | 93.9 /100 | #92 | Exceptional 11.5% |
| Immigrants | Poland | 92.9 /100 | #93 | Exceptional 11.6% |
| Creek | 92.7 /100 | #94 | Exceptional 11.6% |
| Immigrants | Bosnia and Herzegovina | 92.6 /100 | #95 | Exceptional 11.6% |
| Immigrants | Sweden | 92.6 /100 | #96 | Exceptional 11.6% |
| Romanians | 92.3 /100 | #97 | Exceptional 11.6% |
| Immigrants | Japan | 91.9 /100 | #98 | Exceptional 11.6% |
| Immigrants | Ethiopia | 91.7 /100 | #99 | Exceptional 11.6% |
| Syrians | 91.1 /100 | #100 | Exceptional 11.6% |
| Jordanians | 90.8 /100 | #101 | Exceptional 11.6% |
| Guamanians/Chamorros | 90.6 /100 | #102 | Exceptional 11.6% |
| Immigrants | Kuwait | 90.5 /100 | #103 | Exceptional 11.6% |