Australian vs Immigrants from Czechoslovakia Child Poverty Among Boys Under 16
COMPARE
Australian
Immigrants from Czechoslovakia
Child Poverty Among Boys Under 16
Child Poverty Among Boys Under 16 Comparison
Australians
Immigrants from Czechoslovakia
14.7%
CHILD POVERTY AMONG BOYS UNDER 16
98.0/ 100
METRIC RATING
74th/ 347
METRIC RANK
14.4%
CHILD POVERTY AMONG BOYS UNDER 16
98.9/ 100
METRIC RATING
59th/ 347
METRIC RANK
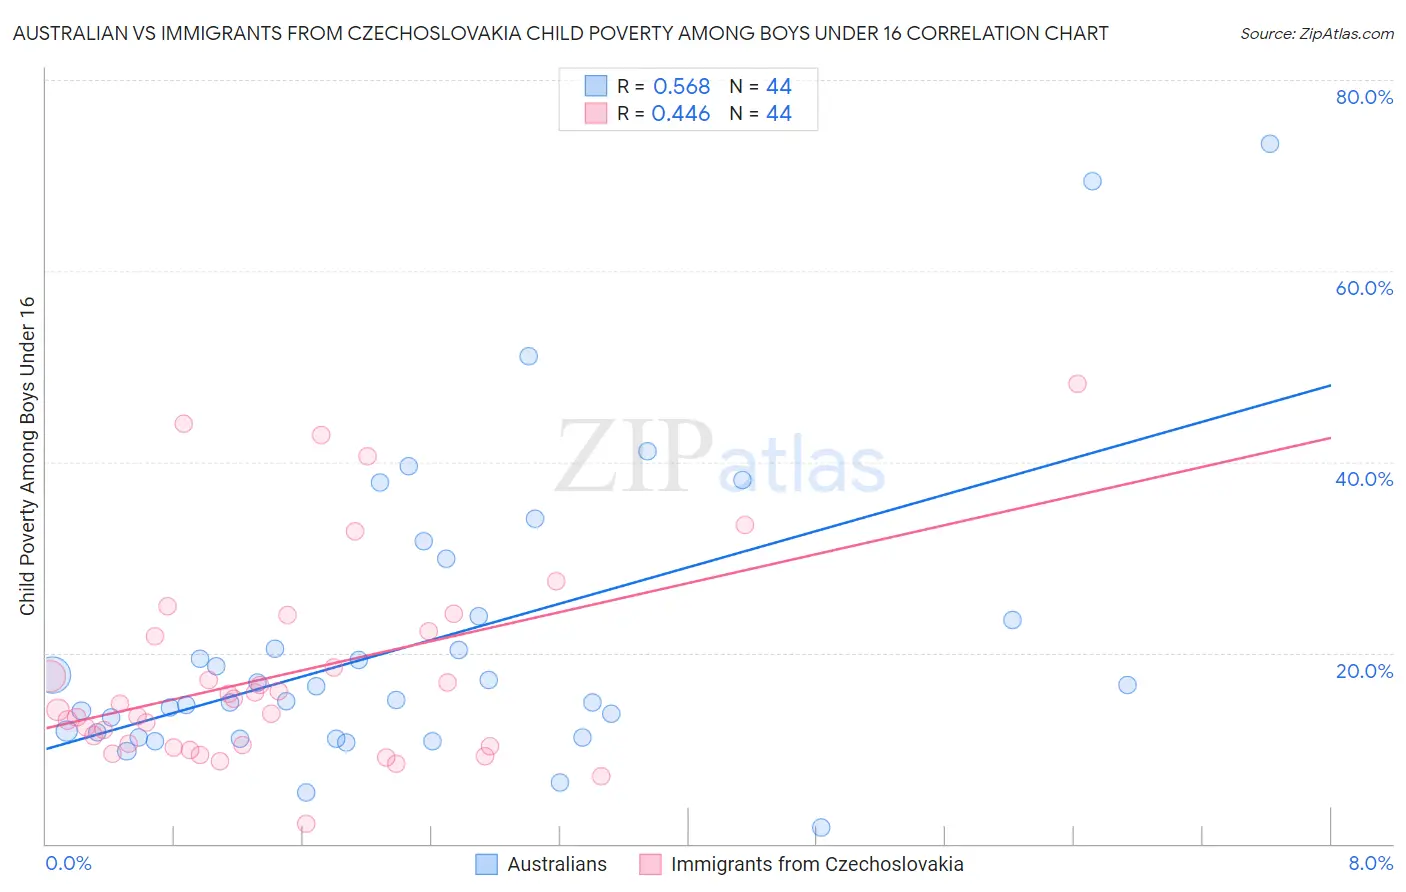
Australian vs Immigrants from Czechoslovakia Child Poverty Among Boys Under 16 Correlation Chart
The statistical analysis conducted on geographies consisting of 221,429,706 people shows a substantial positive correlation between the proportion of Australians and poverty level among boys under the age of 16 in the United States with a correlation coefficient (R) of 0.568 and weighted average of 14.7%. Similarly, the statistical analysis conducted on geographies consisting of 192,998,028 people shows a moderate positive correlation between the proportion of Immigrants from Czechoslovakia and poverty level among boys under the age of 16 in the United States with a correlation coefficient (R) of 0.446 and weighted average of 14.4%, a difference of 1.9%.
Child Poverty Among Boys Under 16 Correlation Summary
| Measurement | Australian | Immigrants from Czechoslovakia |
| Minimum | 1.7% | 2.1% |
| Maximum | 73.3% | 48.2% |
| Range | 71.6% | 46.2% |
| Mean | 21.1% | 17.7% |
| Median | 15.8% | 14.4% |
| Interquartile 25% (IQ1) | 11.4% | 10.3% |
| Interquartile 75% (IQ3) | 23.6% | 21.9% |
| Interquartile Range (IQR) | 12.2% | 11.6% |
| Standard Deviation (Sample) | 15.3% | 10.6% |
| Standard Deviation (Population) | 15.1% | 10.5% |
Demographics Similar to Australians and Immigrants from Czechoslovakia by Child Poverty Among Boys Under 16
In terms of child poverty among boys under 16, the demographic groups most similar to Australians are Immigrants from Turkey (14.6%, a difference of 0.050%), Immigrants from Poland (14.7%, a difference of 0.070%), Immigrants from Latvia (14.6%, a difference of 0.10%), Immigrants from Netherlands (14.6%, a difference of 0.11%), and Immigrants from Croatia (14.7%, a difference of 0.13%). Similarly, the demographic groups most similar to Immigrants from Czechoslovakia are Immigrants from Sweden (14.4%, a difference of 0.020%), Immigrants from Belgium (14.4%, a difference of 0.020%), Polish (14.4%, a difference of 0.10%), Scandinavian (14.4%, a difference of 0.14%), and Zimbabwean (14.3%, a difference of 0.20%).
| Demographics | Rating | Rank | Child Poverty Among Boys Under 16 |
| Zimbabweans | 99.0 /100 | #56 | Exceptional 14.3% |
| Poles | 98.9 /100 | #57 | Exceptional 14.4% |
| Immigrants | Sweden | 98.9 /100 | #58 | Exceptional 14.4% |
| Immigrants | Czechoslovakia | 98.9 /100 | #59 | Exceptional 14.4% |
| Immigrants | Belgium | 98.9 /100 | #60 | Exceptional 14.4% |
| Scandinavians | 98.8 /100 | #61 | Exceptional 14.4% |
| Immigrants | Israel | 98.7 /100 | #62 | Exceptional 14.4% |
| Cambodians | 98.5 /100 | #63 | Exceptional 14.5% |
| Immigrants | Romania | 98.5 /100 | #64 | Exceptional 14.5% |
| Soviet Union | 98.5 /100 | #65 | Exceptional 14.5% |
| Immigrants | Bulgaria | 98.5 /100 | #66 | Exceptional 14.5% |
| Immigrants | Europe | 98.4 /100 | #67 | Exceptional 14.5% |
| Slovenes | 98.4 /100 | #68 | Exceptional 14.5% |
| Immigrants | Austria | 98.4 /100 | #69 | Exceptional 14.5% |
| Europeans | 98.4 /100 | #70 | Exceptional 14.5% |
| Immigrants | Netherlands | 98.1 /100 | #71 | Exceptional 14.6% |
| Immigrants | Latvia | 98.1 /100 | #72 | Exceptional 14.6% |
| Immigrants | Turkey | 98.0 /100 | #73 | Exceptional 14.6% |
| Australians | 98.0 /100 | #74 | Exceptional 14.7% |
| Immigrants | Poland | 97.9 /100 | #75 | Exceptional 14.7% |
| Immigrants | Croatia | 97.9 /100 | #76 | Exceptional 14.7% |