Assyrian/Chaldean/Syriac vs Immigrants from Syria Seniors Poverty Over the Age of 65

COMPARE

Assyrian/Chaldean/Syriac
Race
Ancestry
AfghanAfricanAlaska NativeAlaskan AthabascanAlbanianAleutAlsatianAmericanApacheArabArapahoArgentineanArmenianAssyrian/Chaldean/SyriacAustralianAustrianBahamianBangladeshiBarbadianBasqueBelgianBelizeanBermudanBhutaneseBlackfeetBolivianBrazilianBritishBritish West IndianBulgarianBurmeseCajunCambodianCanadianCape VerdeanCarpatho RusynCelticCentral AmericanCentral American IndianCherokeeCheyenneChickasawChileanChineseChippewaChoctawColombianColvilleComancheCosta RicanCreeCreekCroatianCrowCubanCypriotCzechCzechoslovakianDanishDelawareDominicanDutchDutch West IndianEastern EuropeanEcuadorianEgyptianEnglishEstonianEthiopianEuropeanFijianFilipinoFinnishFrenchFrench American IndianFrench CanadianGermanGerman RussianGhanaianGreekGuamanian/ChamorroGuatemalanGuyaneseHaitianHmongHonduranHopiHoumaHungarianIcelanderIndian (Asian)IndonesianInupiatIranianIraqiIrishIroquoisIsraeliItalianJamaicanJapaneseJordanianKenyanKiowaKoreanLaotianLatvianLebaneseLiberianLithuanianLumbeeLuxembourgerMacedonianMalaysianMalteseMarshalleseMenomineeMexicanMexican American IndianMongolianMoroccanNative HawaiianNavajoNepaleseNew ZealanderNicaraguanNigerianNorthern EuropeanNorwegianOkinawanOsageOttawaPaiutePakistaniPalestinianPanamanianParaguayanPennsylvania GermanPeruvianPimaPolishPortuguesePotawatomiPuebloPuerto RicanPuget Sound SalishRomanianRussianSalvadoranSamoanScandinavianScotch-IrishScottishSeminoleSenegaleseSerbianShoshoneSierra LeoneanSiouxSlavicSlovakSloveneSomaliSouth AfricanSouth AmericanSouth American IndianSoviet UnionSpaniardSpanishSpanish AmericanSpanish American IndianSri LankanSubsaharan AfricanSudaneseSwedishSwissSyrianTaiwaneseThaiTlingit-HaidaTohono O'OdhamTonganTrinidadian and TobagonianTsimshianTurkishU.S. Virgin IslanderUgandanUkrainianUruguayanUteVenezuelanVietnameseWelshWest IndianYakamaYaquiYugoslavianYumanYup'ikZimbabwean
Immigration
NonimmigrantsImmigrantsAfghanistanAfricaAlbaniaArgentinaArmeniaAsiaAustraliaAustriaBahamasBangladeshBarbadosBelarusBelgiumBelizeBoliviaBosnia and HerzegovinaBrazilBulgariaBurma/MyanmarCabo VerdeCambodiaCameroonCanadaCaribbeanCentral AmericaChileChinaColombiaCongoCosta RicaCroatiaCubaCzechoslovakiaDenmarkDominicaDominican RepublicEastern AfricaEastern AsiaEastern EuropeEcuadorEgyptEl SalvadorEnglandEritreaEthiopiaEuropeFijiFranceGermanyGhanaGreeceGrenadaGuatemalaGuyanaHaitiHondurasHong KongHungaryIndiaIndonesiaIranIraqIrelandIsraelItalyJamaicaJapanJordanKazakhstanKenyaKoreaKuwaitLaosLatin AmericaLatviaLebanonLiberiaLithuaniaMalaysiaMexicoMicronesiaMiddle AfricaMoldovaMoroccoNepalNetherlandsNicaraguaNigeriaNorth AmericaNorth MacedoniaNorthern AfricaNorthern EuropeNorwayOceaniaPakistanPanamaPeruPhilippinesPolandPortugalRomaniaRussiaSaudi ArabiaScotlandSenegalSerbiaSierra LeoneSingaporeSomaliaSouth AfricaSouth AmericaSouth Central AsiaSouth Eastern AsiaSouthern EuropeSpainSri LankaSt. Vincent and the GrenadinesSudanSwedenSwitzerlandTaiwanThailandTrinidad and TobagoTurkeyUgandaUkraineUruguayUzbekistanVenezuelaVietnamWest IndiesWestern AfricaWestern AsiaWestern EuropeYemenZaireZimbabweAzores
Immigrants from Syria
Race
Ancestry
AfghanAfricanAlaska NativeAlaskan AthabascanAlbanianAleutAlsatianAmericanApacheArabArapahoArgentineanArmenianAustralianAustrianBahamianBangladeshiBarbadianBasqueBelgianBelizeanBermudanBhutaneseBlackfeetBolivianBrazilianBritishBritish West IndianBulgarianBurmeseCajunCambodianCanadianCape VerdeanCarpatho RusynCelticCentral AmericanCentral American IndianCherokeeCheyenneChickasawChileanChineseChippewaChoctawColombianColvilleComancheCosta RicanCreeCreekCroatianCrowCubanCypriotCzechCzechoslovakianDanishDelawareDominicanDutchDutch West IndianEastern EuropeanEcuadorianEgyptianEnglishEstonianEthiopianEuropeanFijianFilipinoFinnishFrenchFrench American IndianFrench CanadianGermanGerman RussianGhanaianGreekGuamanian/ChamorroGuatemalanGuyaneseHaitianHmongHonduranHopiHoumaHungarianIcelanderIndian (Asian)IndonesianInupiatIranianIraqiIrishIroquoisIsraeliItalianJamaicanJapaneseJordanianKenyanKiowaKoreanLaotianLatvianLebaneseLiberianLithuanianLumbeeLuxembourgerMacedonianMalaysianMalteseMarshalleseMenomineeMexicanMexican American IndianMongolianMoroccanNative HawaiianNavajoNepaleseNew ZealanderNicaraguanNigerianNorthern EuropeanNorwegianOkinawanOsageOttawaPaiutePakistaniPalestinianPanamanianParaguayanPennsylvania GermanPeruvianPimaPolishPortuguesePotawatomiPuebloPuerto RicanPuget Sound SalishRomanianRussianSalvadoranSamoanScandinavianScotch-IrishScottishSeminoleSenegaleseSerbianShoshoneSierra LeoneanSiouxSlavicSlovakSloveneSomaliSouth AfricanSouth AmericanSouth American IndianSoviet UnionSpaniardSpanishSpanish AmericanSpanish American IndianSri LankanSubsaharan AfricanSudaneseSwedishSwissSyrianTaiwaneseThaiTlingit-HaidaTohono O'OdhamTonganTrinidadian and TobagonianTsimshianTurkishU.S. Virgin IslanderUgandanUkrainianUruguayanUteVenezuelanVietnameseWelshWest IndianYakamaYaquiYugoslavianYumanYup'ikZimbabwean
Immigration
NonimmigrantsImmigrantsAfghanistanAfricaAlbaniaArgentinaArmeniaAsiaAustraliaAustriaBahamasBangladeshBarbadosBelarusBelgiumBelizeBoliviaBosnia and HerzegovinaBrazilBulgariaBurma/MyanmarCabo VerdeCambodiaCameroonCanadaCaribbeanCentral AmericaChileChinaColombiaCongoCosta RicaCroatiaCubaCzechoslovakiaDenmarkDominicaDominican RepublicEastern AfricaEastern AsiaEastern EuropeEcuadorEgyptEl SalvadorEnglandEritreaEthiopiaEuropeFijiFranceGermanyGhanaGreeceGrenadaGuatemalaGuyanaHaitiHondurasHong KongHungaryIndiaIndonesiaIranIraqIrelandIsraelItalyJamaicaJapanJordanKazakhstanKenyaKoreaKuwaitLaosLatin AmericaLatviaLebanonLiberiaLithuaniaMalaysiaMexicoMicronesiaMiddle AfricaMoldovaMoroccoNepalNetherlandsNicaraguaNigeriaNorth AmericaNorth MacedoniaNorthern AfricaNorthern EuropeNorwayOceaniaPakistanPanamaPeruPhilippinesPolandPortugalRomaniaRussiaSaudi ArabiaScotlandSenegalSerbiaSierra LeoneSingaporeSomaliaSouth AfricaSouth AmericaSouth Central AsiaSouth Eastern AsiaSouthern EuropeSpainSri LankaSt. Vincent and the GrenadinesSudanSwedenSwitzerlandSyriaTaiwanThailandTrinidad and TobagoTurkeyUgandaUkraineUruguayUzbekistanVenezuelaVietnamWest IndiesWestern AfricaWestern AsiaWestern EuropeYemenZaireZimbabweAzores
Seniors Poverty Over the Age of 65
Income
Poverty
Unemployment
Labor Participation
Family Structure
Vehicle Availability
Education Level
Disability

Seniors Poverty Over the Age of 65 Comparison

Assyrians/Chaldeans/Syriacs

Immigrants from Syria

Exceptional
Average
9.6%
SENIORS POVERTY OVER THE AGE OF 65
99.6/ 100
METRIC RATING
40th/ 347
METRIC RANK
10.9%
SENIORS POVERTY OVER THE AGE OF 65
54.7/ 100
METRIC RATING
172nd/ 347
METRIC RANK

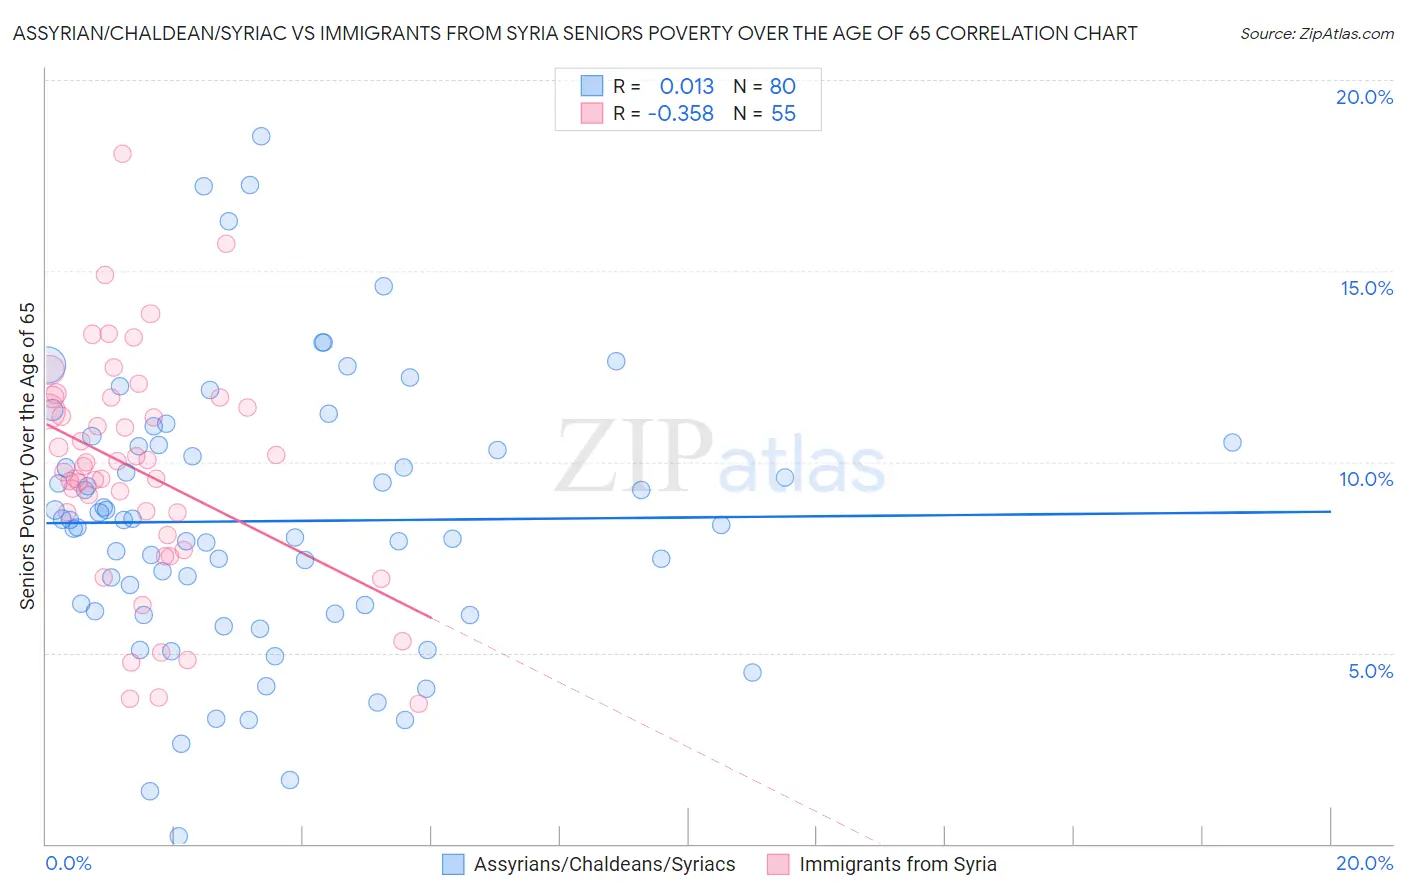
Assyrian/Chaldean/Syriac vs Immigrants from Syria Seniors Poverty Over the Age of 65 Correlation Chart

The statistical analysis conducted on geographies consisting of 110,236,385 people shows no correlation between the proportion of Assyrians/Chaldeans/Syriacs and poverty level among seniors over the age of 65 in the United States with a correlation coefficient (R) of 0.013 and weighted average of 9.6%. Similarly, the statistical analysis conducted on geographies consisting of 173,928,413 people shows a mild negative correlation between the proportion of Immigrants from Syria and poverty level among seniors over the age of 65 in the United States with a correlation coefficient (R) of -0.358 and weighted average of 10.9%, a difference of 13.7%.
Assyrian/Chaldean/Syriac vs Immigrants from Syria Seniors Poverty Over the Age of 65

Seniors Poverty Over the Age of 65 Correlation Summary

MeasurementAssyrian/Chaldean/SyriacImmigrants from Syria
Minimum0.19%3.7%
Maximum18.5%18.1%
Range18.3%14.4%
Mean8.4%9.8%
Median8.4%9.9%
Interquartile 25% (IQ1)6.1%8.1%
Interquartile 75% (IQ3)10.4%11.7%
Interquartile Range (IQR)4.4%3.6%
Standard Deviation (Sample)3.6%3.0%
Standard Deviation (Population)3.6%3.0%

Similar Demographics by Seniors Poverty Over the Age of 65

Demographics Similar to Assyrians/Chaldeans/Syriacs by Seniors Poverty Over the Age of 65

In terms of seniors poverty over the age of 65, the demographic groups most similar to Assyrians/Chaldeans/Syriacs are Greek (9.6%, a difference of 0.12%), Immigrants from North Macedonia (9.6%, a difference of 0.16%), Zimbabwean (9.6%, a difference of 0.32%), Eastern European (9.6%, a difference of 0.42%), and Austrian (9.6%, a difference of 0.51%).
DemographicsRating | RankSeniors Poverty Over the Age of 65
Native Hawaiians
99.8
/100
|
#33
Exceptional
9.4%
British
99.8
/100
|
#34
Exceptional
9.4%
Latvians
99.8
/100
|
#35
Exceptional
9.5%
Czechoslovakians
99.8
/100
|
#36
Exceptional
9.5%
Scotch-Irish
99.7
/100
|
#37
Exceptional
9.5%
Belgians
99.7
/100
|
#38
Exceptional
9.5%
Greeks
99.6
/100
|
#39
Exceptional
9.6%
Assyrians/Chaldeans/Syriacs
99.6
/100
|
#40
Exceptional
9.6%
Immigrants | North Macedonia
99.6
/100
|
#41
Exceptional
9.6%
Zimbabweans
99.6
/100
|
#42
Exceptional
9.6%
Eastern Europeans
99.6
/100
|
#43
Exceptional
9.6%
Austrians
99.5
/100
|
#44
Exceptional
9.6%
Estonians
99.5
/100
|
#45
Exceptional
9.6%
Immigrants | Taiwan
99.5
/100
|
#46
Exceptional
9.7%
Immigrants | South Central Asia
99.5
/100
|
#47
Exceptional
9.7%

Demographics Similar to Immigrants from Syria by Seniors Poverty Over the Age of 65

In terms of seniors poverty over the age of 65, the demographic groups most similar to Immigrants from Syria are Nonimmigrants (10.9%, a difference of 0.040%), Immigrants from Eastern Europe (10.9%, a difference of 0.10%), Sri Lankan (10.9%, a difference of 0.19%), Mongolian (10.9%, a difference of 0.30%), and Spaniard (10.9%, a difference of 0.35%).
DemographicsRating | RankSeniors Poverty Over the Age of 65
Immigrants | South Eastern Asia
62.1
/100
|
#165
Good
10.8%
Malaysians
62.0
/100
|
#166
Good
10.8%
Alaska Natives
60.3
/100
|
#167
Good
10.8%
Mongolians
58.0
/100
|
#168
Average
10.9%
Sri Lankans
56.8
/100
|
#169
Average
10.9%
Immigrants | Eastern Europe
55.8
/100
|
#170
Average
10.9%
Immigrants | Nonimmigrants
55.1
/100
|
#171
Average
10.9%
Immigrants | Syria
54.7
/100
|
#172
Average
10.9%
Spaniards
50.7
/100
|
#173
Average
10.9%
Immigrants | Sudan
50.0
/100
|
#174
Average
10.9%
Creek
49.6
/100
|
#175
Average
10.9%
Immigrants | Malaysia
47.9
/100
|
#176
Average
11.0%
Cherokee
47.3
/100
|
#177
Average
11.0%
German Russians
46.9
/100
|
#178
Average
11.0%
Immigrants | Northern Africa
44.6
/100
|
#179
Average
11.0%