Armenian vs Trinidadian and Tobagonian Seniors Poverty Over the Age of 65
COMPARE
Armenian
Trinidadian and Tobagonian
Seniors Poverty Over the Age of 65
Seniors Poverty Over the Age of 65 Comparison
Armenians
Trinidadians and Tobagonians
12.3%
SENIORS POVERTY OVER THE AGE OF 65
0.3/ 100
METRIC RATING
252nd/ 347
METRIC RANK
14.2%
SENIORS POVERTY OVER THE AGE OF 65
0.0/ 100
METRIC RATING
308th/ 347
METRIC RANK
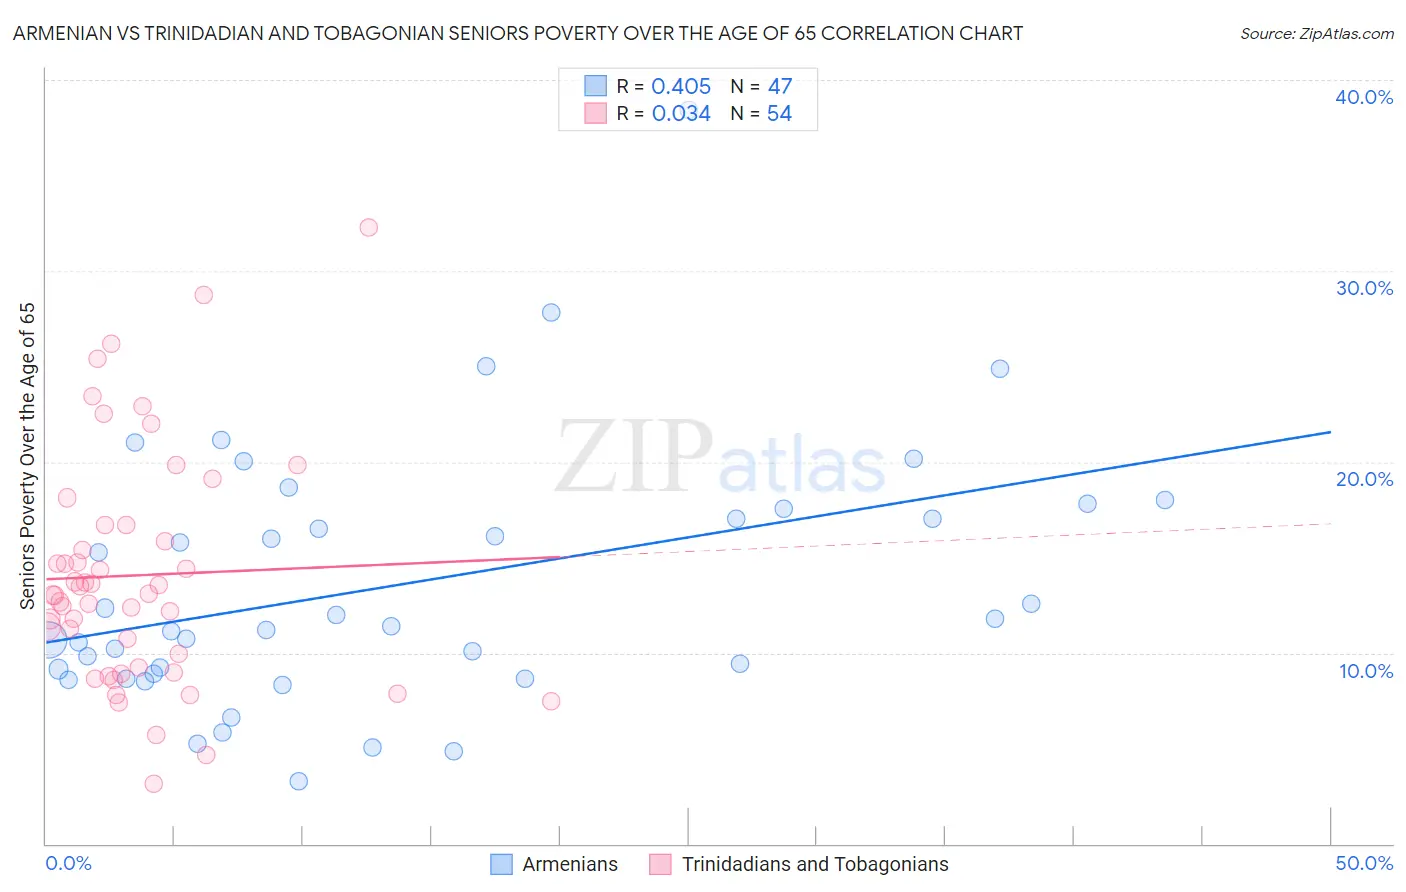
Armenian vs Trinidadian and Tobagonian Seniors Poverty Over the Age of 65 Correlation Chart
The statistical analysis conducted on geographies consisting of 310,185,969 people shows a moderate positive correlation between the proportion of Armenians and poverty level among seniors over the age of 65 in the United States with a correlation coefficient (R) of 0.405 and weighted average of 12.3%. Similarly, the statistical analysis conducted on geographies consisting of 219,204,036 people shows no correlation between the proportion of Trinidadians and Tobagonians and poverty level among seniors over the age of 65 in the United States with a correlation coefficient (R) of 0.034 and weighted average of 14.2%, a difference of 15.1%.
Seniors Poverty Over the Age of 65 Correlation Summary
| Measurement | Armenian | Trinidadian and Tobagonian |
| Minimum | 3.3% | 3.1% |
| Maximum | 38.5% | 32.3% |
| Range | 35.2% | 29.1% |
| Mean | 13.6% | 14.1% |
| Median | 11.4% | 13.1% |
| Interquartile 25% (IQ1) | 8.9% | 9.2% |
| Interquartile 75% (IQ3) | 17.6% | 16.7% |
| Interquartile Range (IQR) | 8.7% | 7.4% |
| Standard Deviation (Sample) | 6.8% | 6.1% |
| Standard Deviation (Population) | 6.7% | 6.0% |
Similar Demographics by Seniors Poverty Over the Age of 65
Demographics Similar to Armenians by Seniors Poverty Over the Age of 65
In terms of seniors poverty over the age of 65, the demographic groups most similar to Armenians are Somali (12.3%, a difference of 0.11%), Shoshone (12.3%, a difference of 0.13%), Immigrants from Cambodia (12.4%, a difference of 0.35%), Mexican American Indian (12.4%, a difference of 0.48%), and Immigrants from Panama (12.4%, a difference of 0.71%).
| Demographics | Rating | Rank | Seniors Poverty Over the Age of 65 |
| Chippewa | 0.7 /100 | #245 | Tragic 12.1% |
| Cree | 0.7 /100 | #246 | Tragic 12.1% |
| Japanese | 0.6 /100 | #247 | Tragic 12.2% |
| Spanish Americans | 0.6 /100 | #248 | Tragic 12.2% |
| Ute | 0.6 /100 | #249 | Tragic 12.2% |
| Immigrants | Liberia | 0.5 /100 | #250 | Tragic 12.2% |
| Somalis | 0.3 /100 | #251 | Tragic 12.3% |
| Armenians | 0.3 /100 | #252 | Tragic 12.3% |
| Shoshone | 0.3 /100 | #253 | Tragic 12.3% |
| Immigrants | Cambodia | 0.3 /100 | #254 | Tragic 12.4% |
| Mexican American Indians | 0.3 /100 | #255 | Tragic 12.4% |
| Immigrants | Panama | 0.2 /100 | #256 | Tragic 12.4% |
| Immigrants | Immigrants | 0.2 /100 | #257 | Tragic 12.4% |
| Dutch West Indians | 0.2 /100 | #258 | Tragic 12.4% |
| Ghanaians | 0.2 /100 | #259 | Tragic 12.4% |
Demographics Similar to Trinidadians and Tobagonians by Seniors Poverty Over the Age of 65
In terms of seniors poverty over the age of 65, the demographic groups most similar to Trinidadians and Tobagonians are Immigrants from West Indies (14.2%, a difference of 0.070%), Honduran (14.2%, a difference of 0.10%), Immigrants from Latin America (14.2%, a difference of 0.21%), Bahamian (14.2%, a difference of 0.36%), and Native/Alaskan (14.2%, a difference of 0.36%).
| Demographics | Rating | Rank | Seniors Poverty Over the Age of 65 |
| U.S. Virgin Islanders | 0.0 /100 | #301 | Tragic 14.0% |
| Yup'ik | 0.0 /100 | #302 | Tragic 14.1% |
| Immigrants | Bangladesh | 0.0 /100 | #303 | Tragic 14.1% |
| West Indians | 0.0 /100 | #304 | Tragic 14.1% |
| Immigrants | Trinidad and Tobago | 0.0 /100 | #305 | Tragic 14.1% |
| Immigrants | Latin America | 0.0 /100 | #306 | Tragic 14.2% |
| Immigrants | West Indies | 0.0 /100 | #307 | Tragic 14.2% |
| Trinidadians and Tobagonians | 0.0 /100 | #308 | Tragic 14.2% |
| Hondurans | 0.0 /100 | #309 | Tragic 14.2% |
| Bahamians | 0.0 /100 | #310 | Tragic 14.2% |
| Natives/Alaskans | 0.0 /100 | #311 | Tragic 14.2% |
| Hispanics or Latinos | 0.0 /100 | #312 | Tragic 14.3% |
| Barbadians | 0.0 /100 | #313 | Tragic 14.4% |
| Guyanese | 0.0 /100 | #314 | Tragic 14.4% |
| Immigrants | Ecuador | 0.0 /100 | #315 | Tragic 14.4% |