Armenian vs Salvadoran Single Mother Poverty
COMPARE
Armenian
Salvadoran
Single Mother Poverty
Single Mother Poverty Comparison
Armenians
Salvadorans
26.8%
SINGLE MOTHER POVERTY
99.9/ 100
METRIC RATING
42nd/ 347
METRIC RANK
30.6%
SINGLE MOTHER POVERTY
1.8/ 100
METRIC RATING
240th/ 347
METRIC RANK
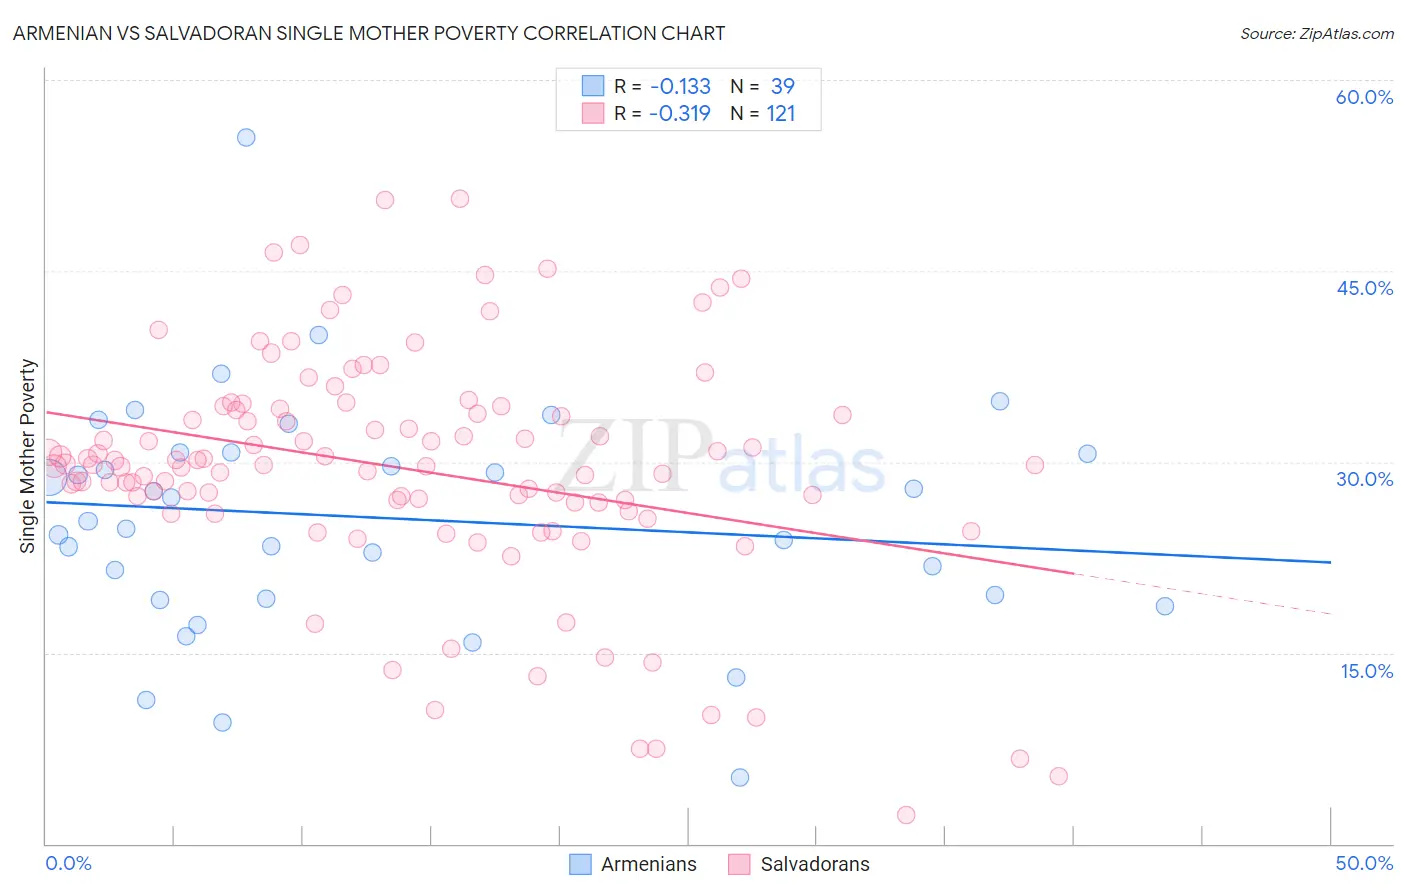
Armenian vs Salvadoran Single Mother Poverty Correlation Chart
The statistical analysis conducted on geographies consisting of 302,870,774 people shows a poor negative correlation between the proportion of Armenians and poverty level among single mothers in the United States with a correlation coefficient (R) of -0.133 and weighted average of 26.8%. Similarly, the statistical analysis conducted on geographies consisting of 391,766,529 people shows a mild negative correlation between the proportion of Salvadorans and poverty level among single mothers in the United States with a correlation coefficient (R) of -0.319 and weighted average of 30.6%, a difference of 14.0%.
Single Mother Poverty Correlation Summary
| Measurement | Armenian | Salvadoran |
| Minimum | 5.2% | 2.2% |
| Maximum | 55.5% | 50.7% |
| Range | 50.3% | 48.5% |
| Mean | 25.6% | 29.5% |
| Median | 25.4% | 29.8% |
| Interquartile 25% (IQ1) | 19.2% | 26.8% |
| Interquartile 75% (IQ3) | 30.7% | 34.2% |
| Interquartile Range (IQR) | 11.5% | 7.3% |
| Standard Deviation (Sample) | 9.2% | 9.2% |
| Standard Deviation (Population) | 9.1% | 9.1% |
Similar Demographics by Single Mother Poverty
Demographics Similar to Armenians by Single Mother Poverty
In terms of single mother poverty, the demographic groups most similar to Armenians are Tsimshian (26.8%, a difference of 0.080%), Immigrants from Sierra Leone (26.9%, a difference of 0.22%), Immigrants from Greece (26.7%, a difference of 0.23%), Latvian (26.9%, a difference of 0.29%), and Immigrants from Vietnam (26.7%, a difference of 0.31%).
| Demographics | Rating | Rank | Single Mother Poverty |
| Maltese | 99.9 /100 | #35 | Exceptional 26.6% |
| Okinawans | 99.9 /100 | #36 | Exceptional 26.6% |
| Immigrants | Israel | 99.9 /100 | #37 | Exceptional 26.6% |
| Immigrants | Fiji | 99.9 /100 | #38 | Exceptional 26.6% |
| Sri Lankans | 99.9 /100 | #39 | Exceptional 26.7% |
| Immigrants | Vietnam | 99.9 /100 | #40 | Exceptional 26.7% |
| Immigrants | Greece | 99.9 /100 | #41 | Exceptional 26.7% |
| Armenians | 99.9 /100 | #42 | Exceptional 26.8% |
| Tsimshian | 99.9 /100 | #43 | Exceptional 26.8% |
| Immigrants | Sierra Leone | 99.9 /100 | #44 | Exceptional 26.9% |
| Latvians | 99.9 /100 | #45 | Exceptional 26.9% |
| Immigrants | Serbia | 99.9 /100 | #46 | Exceptional 26.9% |
| Egyptians | 99.8 /100 | #47 | Exceptional 26.9% |
| Immigrants | Poland | 99.8 /100 | #48 | Exceptional 26.9% |
| Cambodians | 99.8 /100 | #49 | Exceptional 27.0% |
Demographics Similar to Salvadorans by Single Mother Poverty
In terms of single mother poverty, the demographic groups most similar to Salvadorans are Immigrants from Laos (30.6%, a difference of 0.050%), Immigrants from Burma/Myanmar (30.6%, a difference of 0.070%), Immigrants from Portugal (30.5%, a difference of 0.13%), Bermudan (30.6%, a difference of 0.15%), and French (30.7%, a difference of 0.37%).
| Demographics | Rating | Rank | Single Mother Poverty |
| Immigrants | Middle Africa | 3.5 /100 | #233 | Tragic 30.3% |
| Immigrants | Nicaragua | 3.5 /100 | #234 | Tragic 30.3% |
| Immigrants | Grenada | 3.4 /100 | #235 | Tragic 30.3% |
| Welsh | 3.2 /100 | #236 | Tragic 30.4% |
| Immigrants | St. Vincent and the Grenadines | 3.1 /100 | #237 | Tragic 30.4% |
| Slovaks | 2.8 /100 | #238 | Tragic 30.4% |
| Immigrants | Portugal | 2.1 /100 | #239 | Tragic 30.5% |
| Salvadorans | 1.8 /100 | #240 | Tragic 30.6% |
| Immigrants | Laos | 1.8 /100 | #241 | Tragic 30.6% |
| Immigrants | Burma/Myanmar | 1.7 /100 | #242 | Tragic 30.6% |
| Bermudans | 1.6 /100 | #243 | Tragic 30.6% |
| French | 1.3 /100 | #244 | Tragic 30.7% |
| Barbadians | 1.3 /100 | #245 | Tragic 30.7% |
| Ecuadorians | 0.9 /100 | #246 | Tragic 30.8% |
| West Indians | 0.9 /100 | #247 | Tragic 30.8% |